Redbox 2015 Annual Report Download - page 96
Download and view the complete annual report
Please find page 96 of the 2015 Redbox annual report below. You can navigate through the pages in the report by either clicking on the pages listed below, or by using the keyword search tool below to find specific information within the annual report.-
 1
1 -
2
-
3
-
4
-
5
-
6
-
7
-
8
-
9
-
10
-
11
-
12
-
13
-
14
-
15
-
16
-
17
-
18
-
19
-
20
-
21
-
22
-
23
-
24
-
25
-
26
-
27
-
28
-
29
-
30
-
31
-
32
-
33
-
34
-
35
-
36
-
37
-
38
-
39
-
40
-
41
-
42
-
43
-
44
-
45
-
46
-
47
-
48
-
49
-
50
-
51
-
52
-
53
-
54
-
55
-
56
-
57
-
58
-
59
-
60
-
61
-
62
-
63
-
64
-
65
-
66
-
67
-
68
-
69
-
70
-
71
-
72
-
73
-
74
-
75
-
76
-
77
-
78
-
79
-
80
-
81
-
82
-
83
-
84
-
85
-
 86
86 -
 87
87 -
 88
88 -
 89
89 -
 90
90 -
 91
91 -
 92
92 -
 93
93 -
 94
94 -
 95
95 -
 96
96 -
 97
97 -
 98
98 -
 99
99 -
 100
100 -
 101
101 -
 102
102 -
 103
103 -
 104
104 -
 105
105 -
 106
106 -
107
-
108
-
109
-
110
-
111
-
112
-
113
-
114
-
115
-
116
-
117
-
118
-
119
-
120
-
121
-
122
-
123
-
124
-
125
-
126
-
127
-
128
-
129
-
130
 |
 |

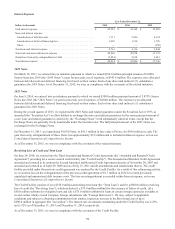
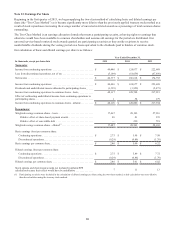
Note 13: Earnings Per Share
Beginning in the first quarter of 2015, we began applying the two-class method of calculating basic and diluted earnings per
share (the “Two-Class Method”) as it became significantly more dilutive than the previously applied treasury stock method as a
result of stock repurchases increasing the average number of unvested restricted awards as a percentage of total common shares
outstanding.
The Two-Class Method is an earnings allocation formula that treats a participating security, as having rights to earnings that
otherwise would have been available to common shareholders and assumes all earnings for the period are distributed. Our
unvested service-based restricted stock awards granted are participating securities as they entitle recipients to receive
nonforfeitable dividends during the vesting period on a basis equivalent to the dividends paid to holders of common stock.
Our calculation of basic and diluted earnings per share is as follows:
Year Ended December 31,
In thousands, except per share data 2015 2014 2013
Numerator
Income from continuing operations . . . . . . . . . . . . . . . . . . . . . . . . . . . . . . . . $ 49,446 $ 124,677 $ 222,688
Loss from discontinued operations, net of tax . . . . . . . . . . . . . . . . . . . . . . . . (5,109) (18,059) (47,896)
Net income . . . . . . . . . . . . . . . . . . . . . . . . . . . . . . . . . . . . . . . . . . . . . . . . . . . $ 44,337 $ 106,618 $ 174,792
Income from continuing operations . . . . . . . . . . . . . . . . . . . . . . . . . . . . . . . . $ 49,446 $ 124,677 $ 222,688
Dividends and undistributed income allocated to participating shares. . . . . . (1,329) (3,929) (5,473)
Income from continuing operations to common shares - basic. . . . . . . . . . . . 48,117 120,748 217,215
Effect of reallocating undistributed income from continuing operations to
participating shares . . . . . . . . . . . . . . . . . . . . . . . . . . . . . . . . . . . . . . . . . . . . . 1 58 179
Income from continuing operations to common shares - diluted . . . . . . . . . . $ 48,118 $ 120,806 $ 217,394
Denominator
Weighted average common shares - basic. . . . . . . . . . . . . . . . . . . . . . . . . . . . 17,467 20,192 27,216
Dilutive effect of share-based payment awards . . . . . . . . . . . . . . . . . . . 20 81 235
Dilutive effect of convertible debt . . . . . . . . . . . . . . . . . . . . . . . . . . . . . — 230 718
Weighted average common shares - diluted(1). . . . . . . . . . . . . . . . . . . . . . . . . 17,487 20,503 28,169
Basic earnings (loss) per common share:
Continuing operations . . . . . . . . . . . . . . . . . . . . . . . . . . . . . . . . . . . . . . . . $ 2.75 $ 5.98 $ 7.98
Discontinued operations. . . . . . . . . . . . . . . . . . . . . . . . . . . . . . . . . . . . . . . (0.29) (0.89) (1.76)
Basic earnings per common share. . . . . . . . . . . . . . . . . . . . . . . . . . . . . . . . . . $ 2.46 $ 5.09 $ 6.22
Diluted earnings (loss) per common share:
Continuing operations . . . . . . . . . . . . . . . . . . . . . . . . . . . . . . . . . . . . . . . . $ 2.75 $ 5.89 $ 7.72
Discontinued operations. . . . . . . . . . . . . . . . . . . . . . . . . . . . . . . . . . . . . . . (0.29) (0.88) (1.70)
Diluted earnings per common share . . . . . . . . . . . . . . . . . . . . . . . . . . . . . . . . $ 2.46 $ 5.01 $ 6.02
Stock options and share-based awards not included in diluted EPS
calculation because their effect would have be antidilutive . . . . . . . . . . . . . . 71113
(1) Participating securities were included in the calculation of diluted earnings per share using the two-class method, as this calculation was more dilutive
than the calculation using the treasury stock method.
88