Redbox 2015 Annual Report Download - page 29
Download and view the complete annual report
Please find page 29 of the 2015 Redbox annual report below. You can navigate through the pages in the report by either clicking on the pages listed below, or by using the keyword search tool below to find specific information within the annual report.-
 1
1 -
2
-
3
-
4
-
5
-
6
-
7
-
8
-
9
-
10
-
11
-
12
-
13
-
14
-
15
-
16
-
17
-
18
-
 19
19 -
 20
20 -
 21
21 -
 22
22 -
 23
23 -
 24
24 -
 25
25 -
 26
26 -
 27
27 -
 28
28 -
 29
29 -
 30
30 -
 31
31 -
 32
32 -
 33
33 -
 34
34 -
 35
35 -
 36
36 -
 37
37 -
 38
38 -
 39
39 -
40
-
41
-
42
-
43
-
44
-
45
-
46
-
47
-
48
-
49
-
50
-
51
-
52
-
53
-
54
-
55
-
56
-
57
-
58
-
59
-
60
-
61
-
62
-
63
-
64
-
65
-
66
-
67
-
68
-
69
-
70
-
71
-
72
-
73
-
74
-
75
-
76
-
77
-
78
-
79
-
80
-
81
-
82
-
83
-
84
-
85
-
86
-
87
-
88
-
89
-
90
-
91
-
92
-
93
-
94
-
95
-
96
-
97
-
98
-
99
-
100
-
101
-
102
-
103
-
104
-
105
-
106
-
107
-
108
-
109
-
110
-
111
-
112
-
113
-
114
-
115
-
116
-
117
-
118
-
119
-
120
-
121
-
122
-
123
-
124
-
125
-
126
-
127
-
128
-
129
-
130
 |
 |

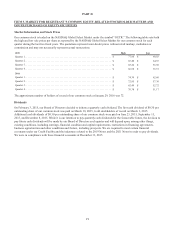
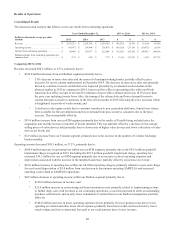
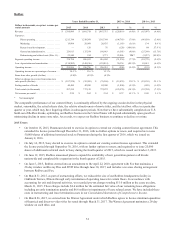
ITEM 6. SELECTED FINANCIAL DATA
The selected consolidated financial data below should be read in conjunction with Management’s Discussion and Analysis of
Financial Condition and Results of Operations and the consolidated financial statements and notes thereto included elsewhere
in this Form 10-K.
In thousands, except per share data Years Ended December 31,
Statement of Comprehensive Income Data 2015 2014 2013 2012 2011
Revenue . . . . . . . . . . . . . . . . . . . . . . . . . . . . . . . . $ 2,193,211 $ 2,291,586 $ 2,299,785 $ 2,198,151 $ 1,844,046
Operating income. . . . . . . . . . . . . . . . . . . . . . . . . $ 168,875 $ 268,404 $ 278,876 $ 287,493 $ 223,014
Income from continuing operations . . . . . . . . . . . $ 49,446 $ 124,677 $ 222,688 $ 166,303 $ 122,934
Loss from discontinued operations, net of tax(1) .(5,109) (18,059) (47,896) (16,073) (19,051)
Net income . . . . . . . . . . . . . . . . . . . . . . . . . . . . . . $ 44,337 $ 106,618 $ 174,792 $ 150,230 $ 103,883
Basic earnings per common share from
continuing operations. . . . . . . . . . . . . . . . . . . . . . $ 2.75 $ 5.98 $ 7.98 $ 5.38 $ 3.95
Loss per common share from discontinued
operations . . . . . . . . . . . . . . . . . . . . . . . . . . . . . . . (0.29) (0.89) (1.76) (0.53) (0.62)
Basic earnings per share attributable to
Outerwall Inc.. . . . . . . . . . . . . . . . . . . . . . . . . . . . $ 2.46 $ 5.09 $ 6.22 $ 4.85 $ 3.33
Diluted earnings per share from continuing
operations per common share. . . . . . . . . . . . . . . . $ 2.75 $ 5.89 $ 7.72 $ 5.10 $ 3.81
Diluted loss per share from discontinued
operations per common share. . . . . . . . . . . . . . . . (0.29) (0.88) (1.70) (0.50) (0.60)
Diluted earnings per share per common share . . . $ 2.46 $ 5.01 $ 6.02 $ 4.60 $ 3.21
Weighted average common shares used in basic
per share calculations . . . . . . . . . . . . . . . . . . . . . . 17,467 20,192 27,216 30,305 30,520
Weighted average common shares used in
diluted per share calculations. . . . . . . . . . . . . . . . 17,487 20,503 28,169 32,012 31,715
As of December 31,
Balance Sheet Data 12/31/2015 12/31/2014 12/31/2013 12/31/2012 12/31/2011
Cash and cash equivalents . . . . . . . . . . . . . . . . . . $ 222,549 $ 242,696 $ 371,437 $ 282,894 $ 341,855
Total assets. . . . . . . . . . . . . . . . . . . . . . . . . . . . . . $ 1,366,060 $ 1,583,286 $ 1,891,383 $ 1,555,365 $ 1,366,625
Total debt, capital lease obligations and other. . . $ 914,497 $ 994,085 $ 785,292 $ 385,760 $ 397,099
Common stock . . . . . . . . . . . . . . . . . . . . . . . . . . . $ 485,163 $ 473,592 $ 482,481 $ 504,881 $ 481,249
Total stockholders’ equity (deficit) . . . . . . . . . . . $ (22,074) $ 97,378 $ 518,689 $ 549,088 $ 513,902
(1) Discontinued operations for all periods presented includes the results of operations from:
our Redbox Canada operations, which we shut down during the first quarter of 2015;
four ventures previously included in our former New Ventures segment, Orango, Rubi, Crisp Market, and Star Studio, which were discontinued
during 2013; and
our Money Transfer Business, which we met the criteria to classify as a discontinued operation in the second quarter of 2010 and sold in June
2011.
21