Redbox 2015 Annual Report Download - page 71
Download and view the complete annual report
Please find page 71 of the 2015 Redbox annual report below. You can navigate through the pages in the report by either clicking on the pages listed below, or by using the keyword search tool below to find specific information within the annual report.-
 1
1 -
2
-
3
-
4
-
5
-
6
-
7
-
8
-
9
-
10
-
11
-
12
-
13
-
14
-
15
-
16
-
17
-
18
-
19
-
20
-
21
-
22
-
23
-
24
-
25
-
26
-
27
-
28
-
29
-
30
-
31
-
32
-
33
-
34
-
35
-
36
-
37
-
38
-
39
-
40
-
41
-
42
-
43
-
44
-
45
-
46
-
47
-
48
-
49
-
50
-
51
-
52
-
53
-
54
-
55
-
56
-
57
-
58
-
59
-
60
-
 61
61 -
 62
62 -
 63
63 -
 64
64 -
 65
65 -
 66
66 -
 67
67 -
 68
68 -
 69
69 -
 70
70 -
 71
71 -
 72
72 -
 73
73 -
 74
74 -
 75
75 -
 76
76 -
 77
77 -
 78
78 -
 79
79 -
 80
80 -
 81
81 -
82
-
83
-
84
-
85
-
86
-
87
-
88
-
89
-
90
-
91
-
92
-
93
-
94
-
95
-
96
-
97
-
98
-
99
-
100
-
101
-
102
-
103
-
104
-
105
-
106
-
107
-
108
-
109
-
110
-
111
-
112
-
113
-
114
-
115
-
116
-
117
-
118
-
119
-
120
-
121
-
122
-
123
-
124
-
125
-
126
-
127
-
128
-
129
-
130
 |
 |

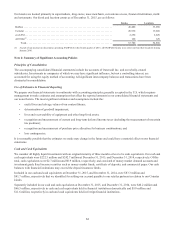
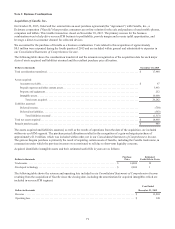
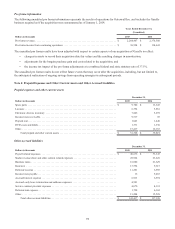
Our kiosks are located primarily in supermarkets, drug stores, mass merchants, convenience stores, financial institutions, malls
and restaurants. Our kiosk and location counts as of December 31, 2015, are as follows:
Kiosks Locations
Redbox . . . . . . . . . . . . . . . . . . . . . . . . . . . . . . . . . . . . . . . . . . . . . . . . . . . . . . . . . . . . . . . . . . . . . 40,480 33,060
Coinstar . . . . . . . . . . . . . . . . . . . . . . . . . . . . . . . . . . . . . . . . . . . . . . . . . . . . . . . . . . . . . . . . . . . . 20,930 19,660
ecoATM . . . . . . . . . . . . . . . . . . . . . . . . . . . . . . . . . . . . . . . . . . . . . . . . . . . . . . . . . . . . . . . . . . . . 2,250 2,020
All Other(1) . . . . . . . . . . . . . . . . . . . . . . . . . . . . . . . . . . . . . . . . . . . . . . . . . . . . . . . . . . . . . . . . . . 120 120
Total. . . . . . . . . . . . . . . . . . . . . . . . . . . . . . . . . . . . . . . . . . . . . . . . . . . . . . . . . . . . . . . . . . . 63,780 54,860
(1) As part of our decision to discontinue operating SAMPLEit in the fourth quarter of 2015, all SAMPLEit kiosks were removed from their locations during
January 2016.
Note 2: Summary of Significant Accounting Policies
Principles of Consolidation
The accompanying consolidated financial statements include the accounts of Outerwall Inc. and our wholly-owned
subsidiaries. Investments in companies of which we may have significant influence, but not a controlling interest, are
accounted for using the equity method of accounting. All significant intercompany balances and transactions have been
eliminated in consolidation.
Use of Estimates in Financial Reporting
We prepare our financial statements in conformity with accounting principles generally accepted in the U.S. which requires
management to make estimates and assumptions that affect the reported amounts in our consolidated financial statements and
our notes thereto. The most significant estimates and assumptions include the:
• useful lives and salvage values of our content library;
• determination of goodwill impairment;
• lives and recoverability of equipment and other long-lived assets;
• recognition and measurement of current and long-term deferred income taxes (including the measurement of uncertain
tax positions);
• recognition and measurement of purchase price allocation for business combinations; and
• loss contingencies.
It is reasonably possible that the estimates we make may change in the future and could have a material effect on our financial
statements.
Cash and Cash Equivalents
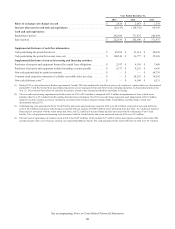
We consider all highly liquid investments with an original maturity of three months or less to be cash equivalents. Our cash and
cash equivalents were $222.5 million and $242.7 million at December 31, 2015, and December 31, 2014, respectively. Of this
total, cash equivalents were $2.7 million and $0.9 million, respectively, and consisted of money market demand accounts and
investment grade fixed income securities such as money market funds, certificate of deposits, and commercial paper. Our cash
balances with financial institutions may exceed the deposit insurance limits.
Included in our cash and cash equivalents at December 31, 2015, and December 31, 2014, were $83.3 million and
$81.7 million, respectively that we identified for settling our accrued payable to our retailer partners in relation to our Coinstar
kiosks.
Separately included in our cash and cash equivalents at December 31, 2015, and December 31, 2014, were $46.2 million and
$66.5 million, respectively in cash and cash equivalents held in financial institutions domestically and $9.0 million and
$11.6 million, respectively in cash and cash equivalents held in foreign financial institutions.
63