Redbox 2015 Annual Report Download - page 100
Download and view the complete annual report
Please find page 100 of the 2015 Redbox annual report below. You can navigate through the pages in the report by either clicking on the pages listed below, or by using the keyword search tool below to find specific information within the annual report.-
 1
1 -
2
-
3
-
4
-
5
-
6
-
7
-
8
-
9
-
10
-
11
-
12
-
13
-
14
-
15
-
16
-
17
-
18
-
19
-
20
-
21
-
22
-
23
-
24
-
25
-
26
-
27
-
28
-
29
-
30
-
31
-
32
-
33
-
34
-
35
-
36
-
37
-
38
-
39
-
40
-
41
-
42
-
43
-
44
-
45
-
46
-
47
-
48
-
49
-
50
-
51
-
52
-
53
-
54
-
55
-
56
-
57
-
58
-
59
-
60
-
61
-
62
-
63
-
64
-
65
-
66
-
67
-
68
-
69
-
70
-
71
-
72
-
73
-
74
-
75
-
76
-
77
-
78
-
79
-
80
-
81
-
82
-
83
-
84
-
85
-
86
-
87
-
88
-
89
-
 90
90 -
 91
91 -
 92
92 -
 93
93 -
 94
94 -
 95
95 -
 96
96 -
 97
97 -
 98
98 -
 99
99 -
 100
100 -
 101
101 -
 102
102 -
 103
103 -
 104
104 -
 105
105 -
 106
106 -
 107
107 -
 108
108 -
 109
109 -
 110
110 -
111
-
112
-
113
-
114
-
115
-
116
-
117
-
118
-
119
-
120
-
121
-
122
-
123
-
124
-
125
-
126
-
127
-
128
-
129
-
130
 |
 |

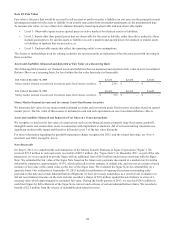
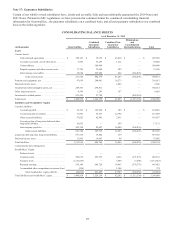
Note 15: Fair Value
Fair value is the price that would be received to sell an asset or paid to transfer a liability (an exit price) in the principal or most
advantageous market for the asset or liability in an orderly transaction between market participants on the measurement date.
To measure fair value, we use a three-tier valuation hierarchy based upon observable and non-observable inputs:
• Level 1: Observable inputs such as quoted prices in active markets for identical assets or liabilities;
• Level 2: Inputs other than quoted prices that are observable for the asset or liability, either directly or indirectly; these
include quoted prices for similar assets or liabilities in active markets and quoted prices for identical or similar assets
or liabilities in markets that are not active; or
• Level 3: Unobservable inputs that reflect the reporting entity’s own assumptions.
The factors or methodology used for valuing securities are not necessarily an indication of the risk associated with investing in
those securities.
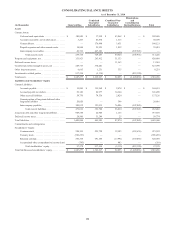
Assets and Liabilities Measured and Reported at Fair Value on a Recurring Basis
The following table presents our financial assets and liabilities that are measured and reported at fair value in our Consolidated
Balance Sheets on a recurring basis, by level within the fair value hierarchy (in thousands):
Fair Value at December 31, 2015 Level 1 Level 2 Level 3
Money market demand accounts and investment grade fixed income securities. . $ 2,743 $ — $ —
Fair Value at December 31, 2014 Level 1 Level 2 Level 3
Money market demand accounts and investment grade fixed income securities. . $916$—$—
Money Market Demand Accounts and Investment Grade Fixed Income Securities
We determine fair value for our money market demand accounts and investment grade fixed income securities based on quoted
market prices. The fair value of these assets is included in cash and cash equivalents on our Consolidated Balance Sheets.
Assets and Liabilities Measured and Reported at Fair Value on a Nonrecurring Basis
We recognize or disclose the fair value of certain assets such as non-financial assets, primarily long-lived assets, goodwill,
intangible assets and certain other assets in connection with impairment evaluations. All of our nonrecurring valuations use
significant unobservable inputs and therefore fall under Level 3 of the fair value hierarchy.
For more information regarding the goodwill impairment charge recognized in 2015, and the related fair value, see Note 6:
Goodwill and Other Intangible Assets.
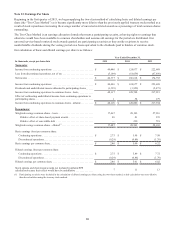
Notes Receivable
On June 9, 2011, we completed the sale transaction of the Money Transfer Business to Sigue Corporation (“Sigue”). We
received $19.5 million in cash and a note receivable of $29.5 million (the “Sigue Note”). In December 2011, as part of the sale
transaction, we were required to provide Sigue with an additional loan of $4.0 million under terms consistent with the Sigue
Note. We estimated the fair value of the Sigue Note based on the future note payments discounted at a market rate for similar
risk profile companies, approximately 18.0%, which reflected our best estimate of default risk, and was not an exit price based
measure of fair value or the stated value on the face of the Sigue Note. We evaluated the Sigue Note for collectability on a
quarterly basis. Our evaluation at September 30, 2013 included consideration of ongoing discussions surrounding early
payment on the note and certain indemnification obligations we have previously undertaken, as a result of our evaluation we
did not record interest income on the note and also recorded a charge of $2.8 million against the note balance to arrive at a
carrying value which approximated its estimated fair value. During the fourth quarter of 2013, we received $24.8 million in
cash from Sigue for full settlement of the Sigue Note, interest and a release of certain indemnification claims. We recorded a
benefit of $2.5 million from the release of indemnification related reserves.
92