Redbox 2015 Annual Report Download - page 107
Download and view the complete annual report
Please find page 107 of the 2015 Redbox annual report below. You can navigate through the pages in the report by either clicking on the pages listed below, or by using the keyword search tool below to find specific information within the annual report.-
 1
1 -
2
-
3
-
4
-
5
-
6
-
7
-
8
-
9
-
10
-
11
-
12
-
13
-
14
-
15
-
16
-
17
-
18
-
19
-
20
-
21
-
22
-
23
-
24
-
25
-
26
-
27
-
28
-
29
-
30
-
31
-
32
-
33
-
34
-
35
-
36
-
37
-
38
-
39
-
40
-
41
-
42
-
43
-
44
-
45
-
46
-
47
-
48
-
49
-
50
-
51
-
52
-
53
-
54
-
55
-
56
-
57
-
58
-
59
-
60
-
61
-
62
-
63
-
64
-
65
-
66
-
67
-
68
-
69
-
70
-
71
-
72
-
73
-
74
-
75
-
76
-
77
-
78
-
79
-
80
-
81
-
82
-
83
-
84
-
85
-
86
-
87
-
88
-
89
-
90
-
91
-
92
-
93
-
94
-
95
-
96
-
 97
97 -
 98
98 -
 99
99 -
 100
100 -
 101
101 -
 102
102 -
 103
103 -
 104
104 -
 105
105 -
 106
106 -
 107
107 -
 108
108 -
 109
109 -
 110
110 -
 111
111 -
 112
112 -
 113
113 -
 114
114 -
 115
115 -
 116
116 -
 117
117 -
118
-
119
-
120
-
121
-
122
-
123
-
124
-
125
-
126
-
127
-
128
-
129
-
130
 |
 |

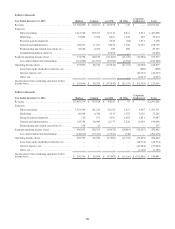
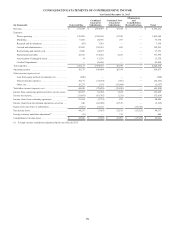
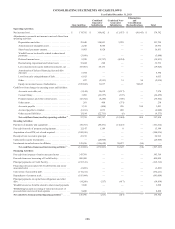
CONSOLIDATING STATEMENTS OF COMPREHENSIVE INCOME
Year Ended December 31, 2015
(in thousands) Outerwall Inc.
Combined
Guarantor
Subsidiaries
Combined Non-
Guarantor
Subsidiaries
Eliminations
and
Consolidation
Reclassifications Total
Revenue. . . . . . . . . . . . . . . . . . . . . . . . . . . . . . . . . . . . . . . . $ 271,430 $ 1,874,457 $ 47,324 $ — $ 2,193,211
Expenses:
Direct operating . . . . . . . . . . . . . . . . . . . . . . . . . . . . . . 143,429 1,328,269 21,390 — 1,493,088
Marketing . . . . . . . . . . . . . . . . . . . . . . . . . . . . . . . . . . . 6,485 28,916 273 — 35,674
Research and development . . . . . . . . . . . . . . . . . . . . . . (83) 7,281 — — 7,198
General and administrative . . . . . . . . . . . . . . . . . . . . . . 47,699 142,012 682 — 190,393
Restructuring and related costs . . . . . . . . . . . . . . . . . . . 2,926 24,227 — — 27,153
Depreciation and other . . . . . . . . . . . . . . . . . . . . . . . . . 32,643 134,522 4,225 — 171,390
Amortization of intangible assets . . . . . . . . . . . . . . . . . 14 13,536 — — 13,550
Goodwill impairment . . . . . . . . . . . . . . . . . . . . . . . . . . — 85,890 — — 85,890
Total expenses. . . . . . . . . . . . . . . . . . . . . . . . . . . . . . . . . . . 233,113 1,764,653 26,570 — 2,024,336
Operating income . . . . . . . . . . . . . . . . . . . . . . . . . . . . . . . . 38,317 109,804 20,754 — 168,875
Other income (expense), net:
Loss from equity method investments, net . . . . . . . . . . (800) — — — (800)
Interest income (expense) . . . . . . . . . . . . . . . . . . . . . . . 30,177 (72,164) (366) — (42,353)
Other, net. . . . . . . . . . . . . . . . . . . . . . . . . . . . . . . . . . . . 15,273 1,354 (19,284) — (2,657)
Total other income (expense), net. . . . . . . . . . . . . . . . . . . . 44,650 (70,810) (19,650) — (45,810)
Income from continuing operations before income taxes. . 82,967 38,994 1,104 — 123,065
Income tax expense. . . . . . . . . . . . . . . . . . . . . . . . . . . . . . . (31,603) (41,785) (231) — (73,619)
Income (loss) from continuing operations . . . . . . . . . . . . . 51,364 (2,791) 873 — 49,446
Income (loss) from discontinued operations, net of tax . . . 640 (28,068) 22,319 — (5,109)
Equity in income (loss) of subsidiaries. . . . . . . . . . . . . . . . (7,667) 23,192 — (15,525) —
Net income (loss) . . . . . . . . . . . . . . . . . . . . . . . . . . . . . . . . 44,337 (7,667) 23,192 (15,525) 44,337
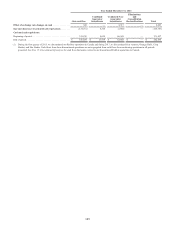
Foreign currency translation adjustment(1) . . . . . . . . . . . . . (31) — 715 — 684
Comprehensive income (loss). . . . . . . . . . . . . . . . . . . . . . . $ 44,306 $ (7,667) $ 23,907 $ (15,525) $ 45,021
(1) Foreign currency translation adjustment had no tax effect in 2015.
99