Redbox 2015 Annual Report Download - page 36
Download and view the complete annual report
Please find page 36 of the 2015 Redbox annual report below. You can navigate through the pages in the report by either clicking on the pages listed below, or by using the keyword search tool below to find specific information within the annual report.-
 1
1 -
2
-
3
-
4
-
5
-
6
-
7
-
8
-
9
-
10
-
11
-
12
-
13
-
14
-
15
-
16
-
17
-
18
-
19
-
20
-
21
-
22
-
23
-
24
-
25
-
 26
26 -
 27
27 -
 28
28 -
 29
29 -
 30
30 -
 31
31 -
 32
32 -
 33
33 -
 34
34 -
 35
35 -
 36
36 -
 37
37 -
 38
38 -
 39
39 -
 40
40 -
 41
41 -
 42
42 -
 43
43 -
 44
44 -
 45
45 -
 46
46 -
47
-
48
-
49
-
50
-
51
-
52
-
53
-
54
-
55
-
56
-
57
-
58
-
59
-
60
-
61
-
62
-
63
-
64
-
65
-
66
-
67
-
68
-
69
-
70
-
71
-
72
-
73
-
74
-
75
-
76
-
77
-
78
-
79
-
80
-
81
-
82
-
83
-
84
-
85
-
86
-
87
-
88
-
89
-
90
-
91
-
92
-
93
-
94
-
95
-
96
-
97
-
98
-
99
-
100
-
101
-
102
-
103
-
104
-
105
-
106
-
107
-
108
-
109
-
110
-
111
-
112
-
113
-
114
-
115
-
116
-
117
-
118
-
119
-
120
-
121
-
122
-
123
-
124
-
125
-
126
-
127
-
128
-
129
-
130
 |
 |

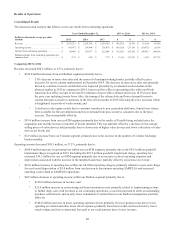
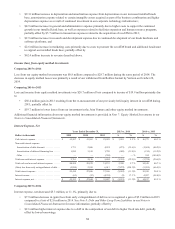
Comparing 2014 to 2013
Revenue decreased $8.2 million, or 0.4%, primarily due to:
• $86.0 million decrease from our Redbox segment primarily due to
4.9% decrease in same store sales primarily due to the relative attractiveness and timing of title releases -
while total box office for content released during 2014 increased 8.1%, significantly lower box office during
certain periods of 2014, in particular content released in the second and third quarters, led to a lack of strong
content throughout the year and contributed to a 7.2% decrease in rentals in 2014; and
$17.1 million decrease in video game rentals primarily due to a lighter release slate during the first and
second quarters because of the game industry’s shift to next generation platforms; partially offset by
• $62.4 million increase from our ecoATM segment primarily due to the inclusion of a full year of results subsequent to
our acquisition of ecoATM on July 23, 2013 and an increase of 1,010 ecoATM kiosks during the year; and
• $15.4 million increase from our Coinstar segment, primarily due to growth in U.S. same store sales driven by a price
increase effective October 1, 2013, higher volume in the U.K. due to an increased kiosk base, growth in U.K. same
store sales driven by a price increase effective August 1, 2014 and growth in the number of Coinstar Exchange kiosks.
Operating income decreased $10.5 million, or 3.8%, primarily due to:
• $23.9 million increase in operating loss within our ecoATM segment, primarily from costs associated with scaling the
ecoATM business and the inclusion of a full year of results in 2014, partially offset by transaction expenses recognized
in 2013 related to the ecoATM acquisition;
• $4.6 million increase in share based expense, which is not allocated to our segments, primarily as a result of rights to
receive cash we issued as replacement awards for unvested restricted stock as part of our acquisition of ecoATM in the
third quarter of 2013; and
• $0.2 million decrease in operating income within our Redbox segment primarily due to the following items which
partially offset the decrease in revenue discussed above:
$46.9 million decrease in direct operating expenses which stayed in line with revenue at 70.1% of revenue in
2014 as compared to 69.4% in 2013;
$25.3 million decrease in general and administrative expenses primarily as a result of ongoing cost reduction
initiatives;
$10.6 million decrease in depreciation and amortization expenses primarily due to certain of our kiosk assets
becoming fully depreciated; partially offset by
• $16.5 million increase in operating income within our Coinstar segment primarily due to revenue growth.
28