Redbox 2015 Annual Report Download - page 67
Download and view the complete annual report
Please find page 67 of the 2015 Redbox annual report below. You can navigate through the pages in the report by either clicking on the pages listed below, or by using the keyword search tool below to find specific information within the annual report.-
 1
1 -
2
-
3
-
4
-
5
-
6
-
7
-
8
-
9
-
10
-
11
-
12
-
13
-
14
-
15
-
16
-
17
-
18
-
19
-
20
-
21
-
22
-
23
-
24
-
25
-
26
-
27
-
28
-
29
-
30
-
31
-
32
-
33
-
34
-
35
-
36
-
37
-
38
-
39
-
40
-
41
-
42
-
43
-
44
-
45
-
46
-
47
-
48
-
49
-
50
-
51
-
52
-
53
-
54
-
55
-
56
-
 57
57 -
 58
58 -
 59
59 -
 60
60 -
 61
61 -
 62
62 -
 63
63 -
 64
64 -
 65
65 -
 66
66 -
 67
67 -
 68
68 -
 69
69 -
 70
70 -
 71
71 -
 72
72 -
 73
73 -
 74
74 -
 75
75 -
 76
76 -
 77
77 -
78
-
79
-
80
-
81
-
82
-
83
-
84
-
85
-
86
-
87
-
88
-
89
-
90
-
91
-
92
-
93
-
94
-
95
-
96
-
97
-
98
-
99
-
100
-
101
-
102
-
103
-
104
-
105
-
106
-
107
-
108
-
109
-
110
-
111
-
112
-
113
-
114
-
115
-
116
-
117
-
118
-
119
-
120
-
121
-
122
-
123
-
124
-
125
-
126
-
127
-
128
-
129
-
130
 |
 |

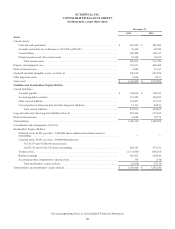
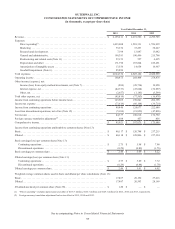
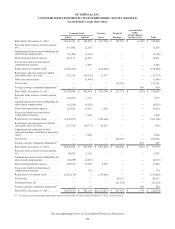
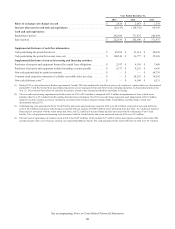
See accompanying Notes to Consolidated Financial Statements
OUTERWALL INC.
CONSOLIDATED STATEMENTS OF CASH FLOWS
(in thousands)
Year Ended December 31,
2015 2014 2013
Operating Activities:
Net income. . . . . . . . . . . . . . . . . . . . . . . . . . . . . . . . . . . . . . . . . . . . . . . . . . . . . . . . . . . . . $ 44,337 $ 106,618 $ 174,792
Adjustments to reconcile net income to net cash flows from operating activities:
Depreciation and other . . . . . . . . . . . . . . . . . . . . . . . . . . . . . . . . . . . . . . . . . . . . . . . 177,247 195,162 193,700
Amortization of intangible assets . . . . . . . . . . . . . . . . . . . . . . . . . . . . . . . . . . . . . . . 13,594 14,692 10,933
Share-based payments expense . . . . . . . . . . . . . . . . . . . . . . . . . . . . . . . . . . . . . . . . . 17,240 13,384 16,831
Windfall excess tax benefits related to share-based payments . . . . . . . . . . . . . . . . . (739) (1,964) (3,698)
Deferred income taxes. . . . . . . . . . . . . . . . . . . . . . . . . . . . . . . . . . . . . . . . . . . . . . . . (19,619) (22,611) (10,933)
Restructuring, impairment and related costs(2) . . . . . . . . . . . . . . . . . . . . . . . . . . . . . 2,054 — 32,732
(Income) loss from equity method investments, net . . . . . . . . . . . . . . . . . . . . . . . . . 800 28,734 (19,928)
Amortization of deferred financing fees and debt discount . . . . . . . . . . . . . . . . . . . 2,761 4,116 6,394
(Gain) loss from early extinguishment of debt . . . . . . . . . . . . . . . . . . . . . . . . . . . . . (5,854) 2,018 6,013
Gain on purchase of Gazelle (Note 3) . . . . . . . . . . . . . . . . . . . . . . . . . . . . . . . . . . . . (989) — —
Goodwill impairment (Note 6) . . . . . . . . . . . . . . . . . . . . . . . . . . . . . . . . . . . . . . . . . 85,890 — —
Other . . . . . . . . . . . . . . . . . . . . . . . . . . . . . . . . . . . . . . . . . . . . . . . . . . . . . . . . . . . . . (972) (1,750) (2,039)
Cash flows from changes in operating assets and liabilities:
Accounts receivable, net . . . . . . . . . . . . . . . . . . . . . . . . . . . . . . . . . . . . . . . . . . . . . . 10,011 8,671 7,978
Content library. . . . . . . . . . . . . . . . . . . . . . . . . . . . . . . . . . . . . . . . . . . . . . . . . . . . . . (8,320) 19,747 (22,459)
Prepaid expenses and other current assets. . . . . . . . . . . . . . . . . . . . . . . . . . . . . . . . . (10,065) 44,282 (50,542)
Other assets . . . . . . . . . . . . . . . . . . . . . . . . . . . . . . . . . . . . . . . . . . . . . . . . . . . . . . . . 162 1,702 230
Accounts payable. . . . . . . . . . . . . . . . . . . . . . . . . . . . . . . . . . . . . . . . . . . . . . . . . . . . 17,943 (68,912) 1,491
Accrued payable to retailers . . . . . . . . . . . . . . . . . . . . . . . . . . . . . . . . . . . . . . . . . . . (9,968) (6,847) (4,088)
Other accrued liabilities. . . . . . . . . . . . . . . . . . . . . . . . . . . . . . . . . . . . . . . . . . . . . . . 10,572 1,309 (9,573)
Net cash flows from operating activities(1). . . . . . . . . . . . . . . . . . . . . . . . . . . . . . . 326,085 338,351 327,834
Investing Activities:
Purchases of property and equipment . . . . . . . . . . . . . . . . . . . . . . . . . . . . . . . . . . . . . . . . (77,591) (97,924) (161,412)
Proceeds from sale of property and equipment . . . . . . . . . . . . . . . . . . . . . . . . . . . . . . . . . 3,225 1,977 13,344
Acquisitions, net of cash acquired. . . . . . . . . . . . . . . . . . . . . . . . . . . . . . . . . . . . . . . . . . . (17,980) — (244,036)
Receipt of note receivable principal . . . . . . . . . . . . . . . . . . . . . . . . . . . . . . . . . . . . . . . . . — — 22,913
Cash paid for equity investments . . . . . . . . . . . . . . . . . . . . . . . . . . . . . . . . . . . . . . . . . . . — (24,500) (28,000)
Extinguishment payment received from equity investment . . . . . . . . . . . . . . . . . . . . . . . — 5,000 —
Net cash flows used in investing activities(1) . . . . . . . . . . . . . . . . . . . . . . . . . . . . . (92,346) (115,447) (397,191)
Financing Activities:
Proceeds from issuance of senior unsecured notes . . . . . . . . . . . . . . . . . . . . . . . . . . . . . . — 295,500 343,769
Proceeds from new borrowing on Credit Facility . . . . . . . . . . . . . . . . . . . . . . . . . . . . . . . 310,500 642,000 400,000
Principal payments on Credit Facility . . . . . . . . . . . . . . . . . . . . . . . . . . . . . . . . . . . . . . . . (339,375) (680,125) (215,313)
Financing costs associated with Credit Facility and senior unsecured notes(3) . . . . . . . . . (9) (2,911) (2,203)
Settlement and conversion of convertible debt . . . . . . . . . . . . . . . . . . . . . . . . . . . . . . . . . — (51,149) (172,211)
Repurchase of Notes (Note 9) . . . . . . . . . . . . . . . . . . . . . . . . . . . . . . . . . . . . . . . . . . . . . . (34,589) ——
Repurchases of common stock(4) . . . . . . . . . . . . . . . . . . . . . . . . . . . . . . . . . . . . . . . . . . . . (159,800) (545,091) (195,004)
Dividends paid (Note 20) . . . . . . . . . . . . . . . . . . . . . . . . . . . . . . . . . . . . . . . . . . . . . . . . . (21,210) — —
Principal payments on capital lease obligations and other debt . . . . . . . . . . . . . . . . . . . . (11,510) (13,996) (14,834)
Windfall excess tax benefits related to share-based payments . . . . . . . . . . . . . . . . . . . . . 739 1,964 3,698
Withholding tax paid on vesting of restricted stock net of proceeds from exercise of
stock options . . . . . . . . . . . . . . . . . . . . . . . . . . . . . . . . . . . . . . . . . . . . . . . . . . . . . . . . . . . (1,461) (520) 8,460
Net cash flows from (used in) financing activities(1) . . . . . . . . . . . . . . . . . . . . . . . $ (256,715) $ (354,328) $ 156,362
59