Redbox 2015 Annual Report Download - page 40
Download and view the complete annual report
Please find page 40 of the 2015 Redbox annual report below. You can navigate through the pages in the report by either clicking on the pages listed below, or by using the keyword search tool below to find specific information within the annual report.-
 1
1 -
2
-
3
-
4
-
5
-
6
-
7
-
8
-
9
-
10
-
11
-
12
-
13
-
14
-
15
-
16
-
17
-
18
-
19
-
20
-
21
-
22
-
23
-
24
-
25
-
26
-
27
-
28
-
29
-
 30
30 -
 31
31 -
 32
32 -
 33
33 -
 34
34 -
 35
35 -
 36
36 -
 37
37 -
 38
38 -
 39
39 -
 40
40 -
 41
41 -
 42
42 -
 43
43 -
 44
44 -
 45
45 -
 46
46 -
 47
47 -
 48
48 -
 49
49 -
 50
50 -
51
-
52
-
53
-
54
-
55
-
56
-
57
-
58
-
59
-
60
-
61
-
62
-
63
-
64
-
65
-
66
-
67
-
68
-
69
-
70
-
71
-
72
-
73
-
74
-
75
-
76
-
77
-
78
-
79
-
80
-
81
-
82
-
83
-
84
-
85
-
86
-
87
-
88
-
89
-
90
-
91
-
92
-
93
-
94
-
95
-
96
-
97
-
98
-
99
-
100
-
101
-
102
-
103
-
104
-
105
-
106
-
107
-
108
-
109
-
110
-
111
-
112
-
113
-
114
-
115
-
116
-
117
-
118
-
119
-
120
-
121
-
122
-
123
-
124
-
125
-
126
-
127
-
128
-
129
-
130
 |
 |

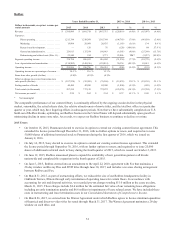
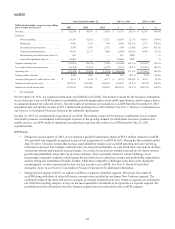
• During the first quarter of 2015, we made the decision to shut down our Redbox Canada operations as the business
was not meeting the company's performance expectations. The results of Redbox Canada have been presented as
discontinued operations on our Consolidated Statements of Comprehensive Income and are no longer included in
segment operating results presented above. See Note 12: Discontinued Operations in our Notes to Consolidated
Financial Statements for additional information.
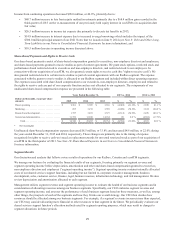
Comparing 2015 to 2014
Revenue decreased $120.8 million, or 6.4%, primarily due to the following:
• $107.9 million decrease from a 5.8% decrease in same store sales primarily due to:
17.7% decline in total movie rentals primarily driven by accelerated secular decline in the physical market in
2015 as compared to 2014, the lower total box office of movie titles released which was 10.4% lower than the
prior year including twenty fewer titles, the timing of the release slate and lower demand for movie content
from price-sensitive customers in the first eleven months of 2015 following the price increases discussed
below which is heightened in periods of weak content; and
A decline in video game rentals due to consumer transition to new generation platforms, limited new release
titles available for those platforms and lower demand from price sensitive customers due to the price increase
discussed below; partially offset by
30 cent increase in the rental price for DVDs to $1.50 per day, effective December 2, 2014, a 50 cent increase
in the rental price for Blu-ray Discs to $2.00 per day, effective December 2, 2014, and a $1.00 increase in the
rental price for video games to $3.00 per day, effective January 6, 2015.
• $12.9 million decrease in revenue primarily from kiosks removed during 2015, due to continued efforts to optimize
our network by removing underperforming kiosks.
We continue to invest in customer-specific promotional offerings to lessen the negative impact on demand driven by the price
increases and the secular decline in the physical market.
Net revenue per rental increased $0.37 to $2.99 primarily due to the impact of the increase in daily rental prices discussed
above, partially offset by an expected increase in single night rental activity as a result of the price increases.
Blu-ray revenue represented 18.0% of total rental revenue and 14.3% of total disc rentals during 2015 as compared with 17.6%
and 14.9% during the prior year. Blu-ray rentals were negatively impacted by fewer Blu-ray releases compared to the prior year
and lower demand in the first eleven months of 2015 as compared to the prior year from price-sensitive customers.
Video game revenue represented 3.5% of total revenue and 1.5% of total disc rentals in 2015 as compared with 4.4% and 2.0%
during the prior year, primarily due to consumer transition to new generation platforms and underperformance of titles released
in the fourth quarter of 2014. Video games also were impacted by lower demand from price-sensitive customers.
Operating income decreased $0.9 million, primarily due to the following:
• $120.8 million decrease in revenue as described above; and
• $23.0 million increase in restructuring and related costs which included restructuring efforts surrounding our Redbox
facility as discussed above, a one-time payment to settle an outstanding purchase commitment and severance related
expenses; partially offset by
• $104.8 million decrease in direct operating expenses, which were 68.9% of revenue during 2015 as compared with
70.1% during the prior year primarily as a result of:
$52.4 million decrease in product costs to $754.4 million primarily due to lower spending on content in 2015,
primarily due to fewer movie releases, a lower average cost per disc due to the mix of movie content and
lower purchases due to fewer kiosks that combined with the revenue impacts discussed above increased gross
margin 0.1% to 57.2% for 2015; and
$52.4 million decrease in other direct operating expenses primarily due to lower contractual fees paid to our
retail partners due to the lower revenue, lower credit card fees driven by the lower volume of rentals, lower
wireless network charges tied to data usage under new contracts starting in January 2015, and lower costs due
to cost containment initiatives related to our field service operations and third party fees for customer service.
• $30.3 million decrease in depreciation and amortization expenses primarily due to an increase in our fully depreciated
asset base partially offset by higher depreciation expense as a result of continued investment in our corporate
technology infrastructure and additional depreciation for newly installed or replaced kiosks; and
32