Redbox 2015 Annual Report Download - page 44
Download and view the complete annual report
Please find page 44 of the 2015 Redbox annual report below. You can navigate through the pages in the report by either clicking on the pages listed below, or by using the keyword search tool below to find specific information within the annual report.-
 1
1 -
2
-
3
-
4
-
5
-
6
-
7
-
8
-
9
-
10
-
11
-
12
-
13
-
14
-
15
-
16
-
17
-
18
-
19
-
20
-
21
-
22
-
23
-
24
-
25
-
26
-
27
-
28
-
29
-
30
-
31
-
32
-
33
-
 34
34 -
 35
35 -
 36
36 -
 37
37 -
 38
38 -
 39
39 -
 40
40 -
 41
41 -
 42
42 -
 43
43 -
 44
44 -
 45
45 -
 46
46 -
 47
47 -
 48
48 -
 49
49 -
 50
50 -
 51
51 -
 52
52 -
 53
53 -
 54
54 -
55
-
56
-
57
-
58
-
59
-
60
-
61
-
62
-
63
-
64
-
65
-
66
-
67
-
68
-
69
-
70
-
71
-
72
-
73
-
74
-
75
-
76
-
77
-
78
-
79
-
80
-
81
-
82
-
83
-
84
-
85
-
86
-
87
-
88
-
89
-
90
-
91
-
92
-
93
-
94
-
95
-
96
-
97
-
98
-
99
-
100
-
101
-
102
-
103
-
104
-
105
-
106
-
107
-
108
-
109
-
110
-
111
-
112
-
113
-
114
-
115
-
116
-
117
-
118
-
119
-
120
-
121
-
122
-
123
-
124
-
125
-
126
-
127
-
128
-
129
-
130
 |
 |

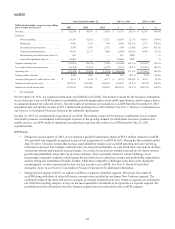
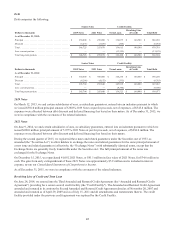
ecoATM
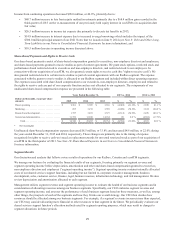
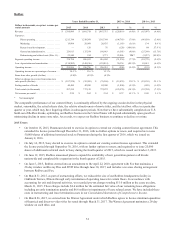
Years Ended December 31, 2015 vs. 2014 2014 vs. 2013
Dollars in thousands, except average selling
price of value devices sold 2015 2014 2013 $%$%
Revenue . . . . . . . . . . . . . . . . . . . . . . . . . . . . . . . . $ 113,558 $ 94,187 $ 31,824 $ 19,371 20.6 % $ 62,363 196.0%
Expenses:
Direct operating. . . . . . . . . . . . . . . . . . . . . . 113,141 92,182 27,271 20,959 22.7 % 64,911 238.0%
Marketing . . . . . . . . . . . . . . . . . . . . . . . . . . 8,481 3,513 938 4,968 141.4 % 2,575 274.5%
Research and development . . . . . . . . . . . . . 5,545 5,691 2,772 (146) (2.6)% 2,919 105.3%
General and administrative . . . . . . . . . . . . . 10,875 12,773 7,868 (1,898) (14.9)% 4,905 62.3%
Restructuring and related costs (Note 11) . . 687 — — 687 NM* — —%
Goodwill impairment (Note 6) . . . . . . . . . . 85,890 — — 85,890 NM* — —%
Segment operating loss. . . . . . . . . . . . . . . . . . . . . (111,061) (19,972) (7,025) (91,089) 456.1 % (12,947) 184.3%
Less: depreciation and amortization. . . . . . . . . . . (26,382) (17,031) (6,077) (9,351) 54.9 % (10,954) 180.3%
Operating loss. . . . . . . . . . . . . . . . . . . . . . . . . . . . $ (137,443) $ (37,003) $ (13,102) $ (100,440) 271.4 % $ (23,901) 182.4%
Ending number of kiosks . . . . . . . . . . . . . . . . . . . 2,250 1,890 880 360 19.0 % 1,010 114.8%
Average selling price of value devices sold . . . . . $ 60.55 $ 76.30 $ 66.11 $ (15.75) (20.6)% $ 10.19 15.4%
Number of value devices sold . . . . . . . . . . . . . . . 1,857,535 1,195,028 444,230 662,507 55.4 % 750,798 169.0%
Number of overall devices sold . . . . . . . . . . . . . . 2,755,919 1,696,565 630,809 1,059,354 62.4 % 1,065,756 169.0%
* Not meaningful
On November 10, 2015, we acquired certain assets and liabilities of Gazelle. The primary reasons for the business combination
were to help drive our ecoATM business to profitability, provide margin and revenue uplift opportunities, and leverage a direct-
to-consumer channel for collected devices. Gazelle results of operations are included in ecoATM from the November 10, 2015
acquisition date and include revenue of $13.3 million and operating loss of $0.9 million. See Note 3: Business Combinations in
our Notes to Consolidated Financial Statement for additional information.
On July 23, 2013 we completed the acquisition of ecoATM. The primary reason for the business combination was to expand
Outerwall’s presence in automated retail and gain exposure to the growing demand for refurbished electronic products and
mobile devices. ecoATM results of operations presented here represent the results of ecoATM from the July 23, 2013
acquisition date.
2015 Events
• During the second quarter of 2015, we recognized a goodwill impairment charge of $85.9 million related to ecoATM.
The goodwill was originally recognized as part of our acquisition of ecoATM in 2013. During the three months ended
June 30, 2015, it became evident that revenue and profitability trends in our ecoATM reporting unit were not being
achieved as expected. For example collection rates, revenue and profitability on a per kiosk basis experienced declines
versus prior periods and expected seasonal trends. As a result, we revised our internal expectations for future revenue
growth and profitability lower than our previous estimates. This is primarily driven by certain challenges in an
increasingly competitive industry which impact the per kiosk device collection, revenue and profitability expectations
and the timing and installation of kiosks. Further, while these competitive challenges grew more acute during the
second quarter, we also experienced the loss of a key executive at ecoATM. See Note 6: Goodwill and Other
Intangible Assets in our Notes to Consolidated Financial Statements for additional information.
• During the first quarter of 2015, we added ecoATM as a separate reportable segment. Previously, the results of
ecoATM along with those of other self-service concepts were included in our former New Ventures segment. The
combined results of the other self-service concepts, previously included in our New Ventures segment, are included in
our All Other reporting category as they do not meet quantitative thresholds to be reported as a separate segment. All
goodwill previously allocated to the New Ventures segment has been allocated to the ecoATM segment.
36