Redbox 2015 Annual Report Download - page 34
Download and view the complete annual report
Please find page 34 of the 2015 Redbox annual report below. You can navigate through the pages in the report by either clicking on the pages listed below, or by using the keyword search tool below to find specific information within the annual report.-
 1
1 -
2
-
3
-
4
-
5
-
6
-
7
-
8
-
9
-
10
-
11
-
12
-
13
-
14
-
15
-
16
-
17
-
18
-
19
-
20
-
21
-
22
-
23
-
 24
24 -
 25
25 -
 26
26 -
 27
27 -
 28
28 -
 29
29 -
 30
30 -
 31
31 -
 32
32 -
 33
33 -
 34
34 -
 35
35 -
 36
36 -
 37
37 -
 38
38 -
 39
39 -
 40
40 -
 41
41 -
 42
42 -
 43
43 -
 44
44 -
45
-
46
-
47
-
48
-
49
-
50
-
51
-
52
-
53
-
54
-
55
-
56
-
57
-
58
-
59
-
60
-
61
-
62
-
63
-
64
-
65
-
66
-
67
-
68
-
69
-
70
-
71
-
72
-
73
-
74
-
75
-
76
-
77
-
78
-
79
-
80
-
81
-
82
-
83
-
84
-
85
-
86
-
87
-
88
-
89
-
90
-
91
-
92
-
93
-
94
-
95
-
96
-
97
-
98
-
99
-
100
-
101
-
102
-
103
-
104
-
105
-
106
-
107
-
108
-
109
-
110
-
111
-
112
-
113
-
114
-
115
-
116
-
117
-
118
-
119
-
120
-
121
-
122
-
123
-
124
-
125
-
126
-
127
-
128
-
129
-
130
 |
 |

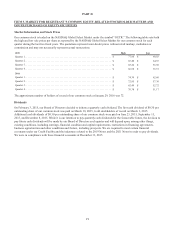
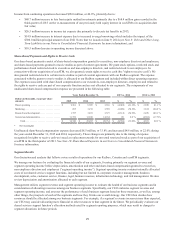
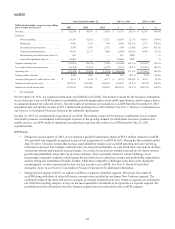
Results of Operations
Consolidated Results
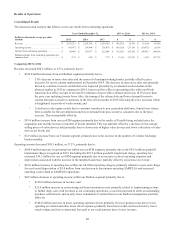
The discussion and analysis that follows covers our results from continuing operations:
Years Ended December 31, 2015 vs. 2014 2014 vs. 2013
Dollars in thousands, except per share
amounts 2015 2014 2013 $%$%
Revenue . . . . . . . . . . . . . . . . . . . . . . . . . . . . . . . . $ 2,193,211 $ 2,291,586 $ 2,299,785 $ (98,375) (4.3)% $ (8,199) (0.4)%
Operating income . . . . . . . . . . . . . . . . . . . . . . . . . $ 168,875 $ 268,404 $ 278,876 $ (99,529) (37.1)% $ (10,472) (3.8)%
Income from continuing operations . . . . . . . . . . . $ 49,446 $ 124,677 $ 222,688 $ (75,231) (60.3)% $ (98,011) (44.0)%
Diluted earnings from continuing operations per
common share. . . . . . . . . . . . . . . . . . . . . . . . . . . . $ 2.75 $ 5.89 $ 7.72 $ (3.14) (53.3)% $ (1.83) (23.7)%
Comparing 2015 to 2014
Revenue decreased $98.4 million, or 4.3%, primarily due to:
• $120.8 million decrease from our Redbox segment primarily due to:
5.8% decrease in same store sales and the removal of underperforming kiosks, partially offset by price
increases for movie content implemented in December 2014. The decrease in same store sales was primarily
driven by a decline in movie rentals that were impacted primarily by accelerated secular decline in the
physical market in 2015 as compared to 2014, lower total box office (representing titles with total North
American box office receipts of at least $5.0 million) of movie titles released which was 10.4% lower than
the prior year including twenty fewer titles, the timing of the release slate and lower demand for movie
content from price-sensitive customers in the first eleven months of 2015 following the price increases which
is heightened in periods of weak content; and
A decline in video game rentals due to consumer transition to new generation platforms, limited new release
titles available for the new platforms and lower demand from price sensitive customers due to the price
increase. This was partially offset by
• $19.4 million increase from our ecoATM segment primarily due to the results of Gazelle being included since the
acquisition date and the increase in number of kiosks installed. This was partially offset by a decrease in the average
selling prices of value devices sold primarily due to a lower mix of higher value devices and lower collections of value
devices per kiosk; and
• $3.0 million increase from our Coinstar segment, primarily due to the increase in the number of Coinstar Exchange
kiosks installed.
Operating income decreased $99.5 million, or 37.1%, primarily due to:
• $100.4 million increase in operating loss within our ecoATM segment, primarily due to the $85.9 million goodwill
impairment charge recognized in 2015. Excluding the $85.9 million goodwill impairment charge, operating loss
increased $14.5 million for our ecoATM segment primarily due to an increase in direct operating expenses and
depreciation associated with the increase in the installed kiosk base, partially offset by an increase in revenue;
• $10.0 million increase in operating loss within our All Other reporting category, primarily related to a non-cash charge
for accelerated depreciation of $5.0 million from our decision to discontinue operating SAMPLEit and increased
operating costs related to SAMPLEit operations.
• $0.9 million decrease in operating income within our Redbox segment primarily due to:
$120.8 million decrease in revenue; and
$23.0 million increase in restructuring and lease termination costs primarily related to implementing actions
to further align costs with revenues in our continuing operations, a one-time payment to settle an outstanding
purchase commitment, and an early lease termination of certain floors at our Redbox headquarters; partially
offset by
$104.8 million decrease in direct operating expenses driven primarily by lower product costs due to lower
spending on content and other lower direct expenses primarily from lower credit card fees driven by lower
rental volume and lower contractual fees paid to our retail partners due to lower revenue;
26