Redbox 2015 Annual Report Download - page 49
Download and view the complete annual report
Please find page 49 of the 2015 Redbox annual report below. You can navigate through the pages in the report by either clicking on the pages listed below, or by using the keyword search tool below to find specific information within the annual report.-
 1
1 -
2
-
3
-
4
-
5
-
6
-
7
-
8
-
9
-
10
-
11
-
12
-
13
-
14
-
15
-
16
-
17
-
18
-
19
-
20
-
21
-
22
-
23
-
24
-
25
-
26
-
27
-
28
-
29
-
30
-
31
-
32
-
33
-
34
-
35
-
36
-
37
-
38
-
 39
39 -
 40
40 -
 41
41 -
 42
42 -
 43
43 -
 44
44 -
 45
45 -
 46
46 -
 47
47 -
 48
48 -
 49
49 -
 50
50 -
 51
51 -
 52
52 -
 53
53 -
 54
54 -
 55
55 -
 56
56 -
 57
57 -
 58
58 -
 59
59 -
60
-
61
-
62
-
63
-
64
-
65
-
66
-
67
-
68
-
69
-
70
-
71
-
72
-
73
-
74
-
75
-
76
-
77
-
78
-
79
-
80
-
81
-
82
-
83
-
84
-
85
-
86
-
87
-
88
-
89
-
90
-
91
-
92
-
93
-
94
-
95
-
96
-
97
-
98
-
99
-
100
-
101
-
102
-
103
-
104
-
105
-
106
-
107
-
108
-
109
-
110
-
111
-
112
-
113
-
114
-
115
-
116
-
117
-
118
-
119
-
120
-
121
-
122
-
123
-
124
-
125
-
126
-
127
-
128
-
129
-
130
 |
 |

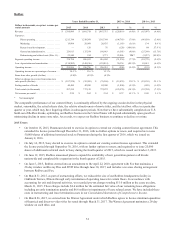
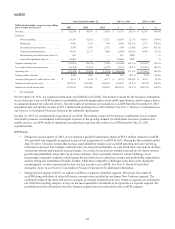
Core Adjusted EBITDA from continuing operations
Our non-GAAP financial measure core adjusted EBITDA from continuing operations is defined as earnings from continuing
operations before depreciation, amortization and other; interest expense, net; income taxes; share-based payments expense; and
Non-Core Adjustments.
A reconciliation of core adjusted EBITDA from continuing operations to net income from continuing operations, the most
comparable GAAP financial measure, is presented in the following table:
Year Ended December 31, 2015 vs. 2014 2014 vs. 2013
Dollars in thousands 2015 2014 2013 $%$%
Net income from continuing operations. . . . . . . . $ 49,446 $ 124,677 $ 222,688 $ (75,231) (60.3)% $ (98,011) (44.0)%
Depreciation, amortization and other . . . . . 184,940 202,478 200,308 (17,538) (8.7)% 2,170 1.1 %
Interest expense, net . . . . . . . . . . . . . . . . . . 42,353 47,644 32,807 (5,291) (11.1)% 14,837 45.2 %
Income taxes expense . . . . . . . . . . . . . . . . . 73,619 66,164 39,710 7,455 11.3 % 26,454 66.6 %
Share-based payments expense(1) . . . . . . . . 17,377 13,384 16,831 3,993 29.8 % (3,447) (20.5)%
Adjusted EBITDA from continuing
operations . . . . . . . . . . . . . . . . . . . . . . 367,735 454,347 512,344 (86,612) (19.1)% (57,997) (11.3)%
Non-Core Adjustments:
Goodwill impairment . . . . . . . . . . . . . . . . . 85,890 — — 85,890 NM* — — %
Restructuring and related costs . . . . . . . . . . 27,153 469 4,495 26,684 NM* (4,026) (89.6)%
Acquisition costs . . . . . . . . . . . . . . . . . . . . . 342 — 5,669 342 NM* (5,669) (100.0)%
Rights to receive cash issued in connection
with the acquisition of ecoATM . . . . . . . . . 4,354 13,270 8,664 (8,916) (67.2)% 4,606 53.2 %
Loss from equity method investments, net .800 28,734 48,448 (27,934) (97.2)% (19,714) (40.7)%
Gain on purchase of Gazelle . . . . . . . . . . . . (989) — — (989) NM* — — %
Sigue indemnification reserve releases . . . . — — (2,542) — — % 2,542 (100.0)%
Gain on previously held equity interest in
ecoATM. . . . . . . . . . . . . . . . . . . . . . . . . . . . — — (68,376) — — % 68,376 (100.0)%
Core adjusted EBITDA from
continuing operations . . . . . . . . . . . . . $ 485,285 $ 496,820 $ 508,702 $ (11,535) (2.3)% $ (11,882) (2.3)%
* Not Meaningful
(1) Includes both non-cash share-based compensation for executives, non-employee directors and employees as well as share-based payments for content
arrangements.
Comparing 2015 to 2014
The decrease in our core adjusted EBITDA from continuing operations was primarily due to lower segment operating income
in our Redbox and ecoATM segments. The other significant components of core adjusted EBITDA from continuing operations
have been discussed previously in the Results of Operations section above.
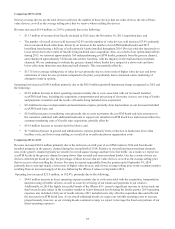
Comparing 2014 to 2013
The decrease in our core adjusted EBITDA from continuing operations was primarily due to:
• Lower segment operating income in our Redbox segment, and
• Higher segment operating loss in our ecoATM segment, partially offset by
• Higher segment operating income in our Coinstar segment.
The other significant components of core adjusted EBITDA from continuing operations have been discussed previously in the
Results of Operations section above.
41