Redbox 2015 Annual Report Download - page 65
Download and view the complete annual report
Please find page 65 of the 2015 Redbox annual report below. You can navigate through the pages in the report by either clicking on the pages listed below, or by using the keyword search tool below to find specific information within the annual report.-
 1
1 -
2
-
3
-
4
-
5
-
6
-
7
-
8
-
9
-
10
-
11
-
12
-
13
-
14
-
15
-
16
-
17
-
18
-
19
-
20
-
21
-
22
-
23
-
24
-
25
-
26
-
27
-
28
-
29
-
30
-
31
-
32
-
33
-
34
-
35
-
36
-
37
-
38
-
39
-
40
-
41
-
42
-
43
-
44
-
45
-
46
-
47
-
48
-
49
-
50
-
51
-
52
-
53
-
54
-
 55
55 -
 56
56 -
 57
57 -
 58
58 -
 59
59 -
 60
60 -
 61
61 -
 62
62 -
 63
63 -
 64
64 -
 65
65 -
 66
66 -
 67
67 -
 68
68 -
 69
69 -
 70
70 -
 71
71 -
 72
72 -
 73
73 -
 74
74 -
 75
75 -
76
-
77
-
78
-
79
-
80
-
81
-
82
-
83
-
84
-
85
-
86
-
87
-
88
-
89
-
90
-
91
-
92
-
93
-
94
-
95
-
96
-
97
-
98
-
99
-
100
-
101
-
102
-
103
-
104
-
105
-
106
-
107
-
108
-
109
-
110
-
111
-
112
-
113
-
114
-
115
-
116
-
117
-
118
-
119
-
120
-
121
-
122
-
123
-
124
-
125
-
126
-
127
-
128
-
129
-
130
 |
 |

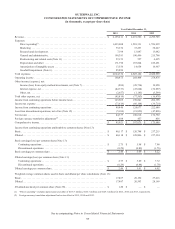
OUTERWALL INC.
CONSOLIDATED STATEMENTS OF COMPREHENSIVE INCOME
(in thousands, except per share data)
Year Ended December 31,
2015 2014 2013
Revenue. . . . . . . . . . . . . . . . . . . . . . . . . . . . . . . . . . . . . . . . . . . . . . . . . . . . . . . . . . . . . . . . $ 2,193,211 $ 2,291,586 $ 2,299,785
Expenses:
Direct operating(1) . . . . . . . . . . . . . . . . . . . . . . . . . . . . . . . . . . . . . . . . . . . . . . . . . . . . 1,493,088 1,581,311 1,556,999
Marketing . . . . . . . . . . . . . . . . . . . . . . . . . . . . . . . . . . . . . . . . . . . . . . . . . . . . . . . . . . 35,674 35,293 30,227
Research and development . . . . . . . . . . . . . . . . . . . . . . . . . . . . . . . . . . . . . . . . . . . . . 7,198 13,047 13,082
General and administrative . . . . . . . . . . . . . . . . . . . . . . . . . . . . . . . . . . . . . . . . . . . . . 190,393 190,496 215,798
Restructuring and related costs (Note 11) . . . . . . . . . . . . . . . . . . . . . . . . . . . . . . . . . . 27,153 557 4,495
Depreciation and other . . . . . . . . . . . . . . . . . . . . . . . . . . . . . . . . . . . . . . . . . . . . . . . . 171,390 187,824 189,401
Amortization of intangible assets . . . . . . . . . . . . . . . . . . . . . . . . . . . . . . . . . . . . . . . . 13,550 14,654 10,907
Goodwill impairment (Note 6) . . . . . . . . . . . . . . . . . . . . . . . . . . . . . . . . . . . . . . . . . . 85,890 — —
Total expenses. . . . . . . . . . . . . . . . . . . . . . . . . . . . . . . . . . . . . . . . . . . . . . . . . . . . . . . . . . . 2,024,336 2,023,182 2,020,909
Operating income . . . . . . . . . . . . . . . . . . . . . . . . . . . . . . . . . . . . . . . . . . . . . . . . . . . . . . . . 168,875 268,404 278,876
Other income (expense), net:
Income (loss) from equity method investments, net (Note 7). . . . . . . . . . . . . . . . . . . (800) (28,734) 19,928
Interest expense, net . . . . . . . . . . . . . . . . . . . . . . . . . . . . . . . . . . . . . . . . . . . . . . . . . . (42,353) (47,644) (32,807)
Other, net. . . . . . . . . . . . . . . . . . . . . . . . . . . . . . . . . . . . . . . . . . . . . . . . . . . . . . . . . . . (2,657) (1,185) (3,599)
Total other expense, net. . . . . . . . . . . . . . . . . . . . . . . . . . . . . . . . . . . . . . . . . . . . . . . . . . . . (45,810) (77,563) (16,478)
Income from continuing operations before income taxes . . . . . . . . . . . . . . . . . . . . . . . . . . 123,065 190,841 262,398
Income tax expense . . . . . . . . . . . . . . . . . . . . . . . . . . . . . . . . . . . . . . . . . . . . . . . . . . . . . . . (73,619) (66,164) (39,710)
Income from continuing operations . . . . . . . . . . . . . . . . . . . . . . . . . . . . . . . . . . . . . . . . . . 49,446 124,677 222,688
Loss from discontinued operations, net of tax (Note 12) . . . . . . . . . . . . . . . . . . . . . . . . . . (5,109) (18,059) (47,896)
Net income . . . . . . . . . . . . . . . . . . . . . . . . . . . . . . . . . . . . . . . . . . . . . . . . . . . . . . . . . . . . . 44,337 106,618 174,792
Foreign currency translation adjustment(2) . . . . . . . . . . . . . . . . . . . . . . . . . . . . . . . . . . . . . 684 457 856
Comprehensive income. . . . . . . . . . . . . . . . . . . . . . . . . . . . . . . . . . . . . . . . . . . . . . . . . . . . $ 45,021 $ 107,075 $ 175,648
Income from continuing operations attributable to common shares (Note 13):
Basic . . . . . . . . . . . . . . . . . . . . . . . . . . . . . . . . . . . . . . . . . . . . . . . . . . . . . . . . . . . . . . . . . . $ 48,117 $ 120,748 $ 217,215
Diluted. . . . . . . . . . . . . . . . . . . . . . . . . . . . . . . . . . . . . . . . . . . . . . . . . . . . . . . . . . . . . . . . . $ 48,118 $ 120,806 $ 217,394
Basic earnings (loss) per common share (Note 13):
Continuing operations . . . . . . . . . . . . . . . . . . . . . . . . . . . . . . . . . . . . . . . . . . . . . . . . . . $ 2.75 $ 5.98 $ 7.98
Discontinued operations. . . . . . . . . . . . . . . . . . . . . . . . . . . . . . . . . . . . . . . . . . . . . . . . . (0.29) (0.89) (1.76)
Basic earnings per common share. . . . . . . . . . . . . . . . . . . . . . . . . . . . . . . . . . . . . . . . . . . . $ 2.46 $ 5.09 $ 6.22
Diluted earnings (loss) per common share (Note 13):
Continuing operations . . . . . . . . . . . . . . . . . . . . . . . . . . . . . . . . . . . . . . . . . . . . . . . . . . $ 2.75 $ 5.89 $ 7.72
Discontinued operations. . . . . . . . . . . . . . . . . . . . . . . . . . . . . . . . . . . . . . . . . . . . . . . . . (0.29) (0.88) (1.70)
Diluted earnings per common share . . . . . . . . . . . . . . . . . . . . . . . . . . . . . . . . . . . . . . . . . . $ 2.46 $ 5.01 $ 6.02
Weighted average common shares used in basic and diluted per share calculations (Note 13):
Basic . . . . . . . . . . . . . . . . . . . . . . . . . . . . . . . . . . . . . . . . . . . . . . . . . . . . . . . . . . . . . . . . . . 17,467 20,192 27,216
Diluted. . . . . . . . . . . . . . . . . . . . . . . . . . . . . . . . . . . . . . . . . . . . . . . . . . . . . . . . . . . . . . . . . 17,487 20,503 28,169
Dividends declared per common share (Note 20). . . . . . . . . . . . . . . . . . . . . . . . . . . . . . . . $ 1.20 $ — $ —
(1) “Direct operating” excludes depreciation and other of $118.7 million, $125.7 million and $129.1 million for 2015, 2014 and 2013, respectively.
(2) Foreign currency translation adjustment had no tax effect in 2015, 2014 and 2013.
57
See accompanying Notes to Consolidated Financial Statements