Pentax 2003 Annual Report Download - page 57
Download and view the complete annual report
Please find page 57 of the 2003 Pentax annual report below. You can navigate through the pages in the report by either clicking on the pages listed below, or by using the keyword search tool below to find specific information within the annual report.-
 1
1 -
2
-
3
-
4
-
5
-
6
-
7
-
8
-
9
-
10
-
11
-
12
-
13
-
14
-
15
-
16
-
17
-
18
-
19
-
20
-
21
-
22
-
23
-
24
-
25
-
26
-
27
-
28
-
29
-
30
-
31
-
32
-
33
-
34
-
35
-
36
-
37
-
38
-
39
-
40
-
41
-
42
-
43
-
44
-
45
-
46
-
 47
47 -
 48
48 -
 49
49 -
 50
50 -
 51
51 -
 52
52 -
 53
53 -
 54
54 -
 55
55 -
 56
56 -
 57
57 -
 58
58 -
 59
59 -
 60
60 -
 61
61 -
 62
62 -
 63
63 -
 64
64 -
 65
65 -
 66
66
 |
 |

55
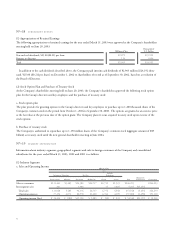
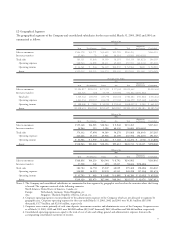
(2) Geographical Segments
The geographical segments of the Company and consolidated subsidiaries for the years ended March 31, 2003, 2002 and 2001 are
summarized as follows: Millions of Yen
2003
Eliminations
Japan North America Europe Asia Total and Corporate Consolidated
Sales to customers ¥166,178 ¥35,771 ¥32,639 ¥11,705 ¥246,293 ¥246,293
Interarea transfers 17,343 73 1,891 44,514 63,821 ¥(63,821)
Total sales 183,521 35,844 34,530 56,219 310,114 (63,821) 246,293
Operating expenses 148,960 34,898 28,411 45,282 257,551 (64,241) 193,310
Operating income ¥034,561 ¥00,946 ¥6,119 ¥10,937 ¥052,563 ¥420 ¥052,983
Assets ¥139,012 ¥19,505 ¥34,970 ¥59,156 ¥252,643 ¥21,646 ¥274,289
Thousands of U.S. Dollars
2003
Eliminations
Japan North America Europe Asia Total and Corporate Consolidated
Sales to customers $1,384,817 $298,092 $271,991 $097,542 $2,052,442 $2,052,442
Interarea transfers 144,525 608 15,759 370,950 531,842 $(531,842)
Total sales 1,529,342 298,700 287,750 468,492 2,584,284 (531,842) 2,052,442
Operating expenses 1,241,334 290,817 236,758 377,350 2,146,259 (535,342) 1,610,917
Operating income $0,288,008 $007,883 $050,992 $091,142 $438,025 $ 3,500 $0,441,525
Assets $1,158,433 $162,542 $291,417 $492,967 $2,105,359 $ 180,383 $2,285,742
Millions of Yen
2002
Eliminations
Japan North America Europe Asia Total and Corporate Consolidated
Sales to customers ¥159,368 ¥36,985 ¥28,964 ¥09,948 ¥235,265 ¥235,265
Interarea transfers 14,964 113 1,196 40,330 56,603 ¥(56,603)
Total sales 174,332 37,098 30,160 50,278 291,868 (56,603) 235,265
Operating expenses 143,426 35,139 25,918 43,109 247,592 (56,225) 191,367
Operating income ¥030,906 ¥01,959 ¥04,242 ¥07,169 ¥044,276 ¥ (378) ¥043,898
Assets ¥138,963 ¥21,000 ¥30,356 ¥55,412 ¥245,731 ¥(32,337 ¥278,068
Millions of Yen
2001
Eliminations
Japan North America Europe Asia Total and Corporate Consolidated
Sales to customers ¥168,856 ¥34,210 ¥24,944 ¥08,792 ¥236,802 ¥236,802
Interarea transfers 17,928 548 893 39,237 58,606 ¥(58,606)
Total sales 186,784 34,758 25,837 48,029 295,408 (58,606) 236,802
Operating expenses 150,991 34,295 22,811 41,131 249,228 (57,554) 191,674
Operating income ¥035,793 ¥00,463 ¥03,026 ¥06,898 ¥046,180 ¥ (1,052) ¥045,128
Assets ¥139,320 ¥21,073 ¥27,000 ¥48,144 ¥235,537 ¥ 32,074 ¥267,611
Notes:1. The Company and consolidated subsidiaries are summarized in four segments by geographic area based on the countries where the Group
is located. The segments consisted of the following countries:
North America:United States of America, Canada, etc.
Europe: Netherlands, Germany, United Kingdom, etc.
Asia: Singapore, Thailand, Republic of Korea, Taiwan, etc.
2. Corporate operating expenses consist primarily of the administration expenses of the Company, which are not allocated to segments by
geographic area. Corporate operating expenses for the years ended March 31, 2003, 2002 and 2001 were ¥1,813 million ($15,108
thousand), ¥1,771million and ¥2,149 million, respectively.
3. Corporate assets consist primarily of cash, time deposits, investments securities and administrative assets of the Company. Corporate assets
as of March 31, 2003, 2002 and 2001 were ¥40,280 million ($335,667 thousand), ¥48,342 million and ¥44,664 million, respectively.
4. Consolidated operating expenses are equal to the total of cost of sales and selling, general and administrative expenses shown in the
accompanying consolidated statements of income.