Pentax 2003 Annual Report Download - page 41
Download and view the complete annual report
Please find page 41 of the 2003 Pentax annual report below. You can navigate through the pages in the report by either clicking on the pages listed below, or by using the keyword search tool below to find specific information within the annual report.-
 1
1 -
2
-
3
-
4
-
5
-
6
-
7
-
8
-
9
-
10
-
11
-
12
-
13
-
14
-
15
-
16
-
17
-
18
-
19
-
20
-
21
-
22
-
23
-
24
-
25
-
26
-
27
-
28
-
29
-
30
-
 31
31 -
 32
32 -
 33
33 -
 34
34 -
 35
35 -
 36
36 -
 37
37 -
 38
38 -
 39
39 -
 40
40 -
 41
41 -
 42
42 -
 43
43 -
 44
44 -
 45
45 -
 46
46 -
 47
47 -
 48
48 -
 49
49 -
 50
50 -
 51
51 -
52
-
53
-
54
-
55
-
56
-
57
-
58
-
59
-
60
-
61
-
62
-
63
-
64
-
65
-
66
 |
 |

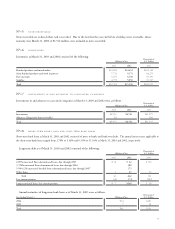
39
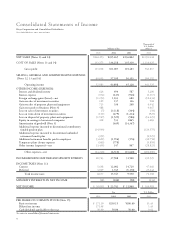
Thousands of
U.S. Dollars
Millions of Yen (Note 1)
2003 2002 2001 2003
OPERATING ACTIVITIES:
Income before income taxes and minority interests ¥28,743 ¥37,588 ¥31,508 $239,525
Adjustments for:
Income taxes—paid (11,509) (15,395) (13,421) (95,908)
Depreciation and amortization 19,792 19,636 17,791 164,933
Amortization of goodwill 469 14,347
Provision for (reversal of) allowance for doubtful receivables (6) (1,530) 605 (50)
Provision for (reversal of) accrued bonuses to employees (360) (191) 87 (3,000)
Reversal of accrued retirement benefits (7,256) (1,193) (798) (60,467)
Provision for (reversal of) reserve for periodic repairs (367) 243 (59) (3,058)
Losses on write-down of investment securities 111 479 1,214 925
Gain on sales of investment securities (109) (137) (126) (908)
Gain on sales of property, plant and equipment (725) (336) (268) (6,042)
Loss on sales of investment securities 73,118 364 58
Loss on disposal of property, plant and equipment 1,947 1,529 986 16,225
Foreign exchange loss (gain) 706 (305) (753) 5,883
Bonuses to directors (150) (195) (251) (1,250)
Equity in earnings of associated companies (418) (533) (1,865) (3,483)
Gain on transfer of business (488) (4,067)
Other 842 632 363 7,017
Changes in assets and liabilities:
Decrease (increase) in notes and accounts receivable 628 (915) (6,146) 5,234
Decrease (increase) in inventories 3,208 2,861 (1,749) 26,733
Decrease (increase) in interest and dividend receivable (80) 194 463 (667)
Decrease (increase) in other current assets 2,060 272 (510) 17,167
Increase (decrease) in notes and accounts payable 555 (4,180) 1,544 4,625
Increase (decrease) in interest payable 12 1(32) 100
Increase (decrease) in other current liabilities 1,247 (1,089) (556) 10,392
Total adjustments 9,647 3,435 11,230 80,392
Net cash provided by operating activities 38,390 41,023 42,738 319,917
INVESTING ACTIVITIES:
Proceeds from sales of investment securities 321 1,631 1,972 2,675
Purchases of investment securities (346) (119) (2,706) (2,883)
Payment for purchase of consolidated subsidiaries, net of cash acquired
(1,301) (785) (16,409) (10,842)
Proceeds from sales of property, plant and equipment 2,254 480 695 18,783
Purchases of property, plant and equipment (14,213) (19,001) (21,589) (118,442)
Decrease in other assets 563 557 1,246 4,692
Increase in other assets (1,755) (2,417) (2,675) (14,625)
Proceeds from transfer of business 894 7,450
Net cash used in investing activities (13,583) (19,654) (39,466) (113,192)
FINANCING ACTIVITIES:
Net decrease in short-term borrowings (1,265) (1,722) (83) (10,541)
Proceeds from long-term bank loans 91 308
Repayments of long-term bank loans (434) (126) (222) (3,617)
Proceeds from sales of treasury stock 11 363
Payments for purchases of treasury stock (7,036) (28) (348) (58,633)
Dividends paid (5,813) (6,412) (4,582) (48,442)
Net cash used in financing activities (14,548) (8,186) (4,564) (121,233)
Consolidated Statements of Cash Flows
Hoya Corporation and Consolidated Subsidiaries
Years Ended March 31, 2003, 2002 and 2001