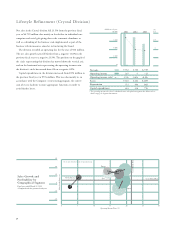
Pentax 2003 Annual Report Download - page 25
Download and view the complete annual report
Please find page 25 of the 2003 Pentax annual report below. You can navigate through the pages in the report by either clicking on the pages listed below, or by using the keyword search tool below to find specific information within the annual report.-
 1
1 -
2
-
3
-
4
-
5
-
6
-
7
-
8
-
9
-
10
-
11
-
12
-
13
-
14
-
 15
15 -
 16
16 -
 17
17 -
 18
18 -
 19
19 -
 20
20 -
 21
21 -
 22
22 -
 23
23 -
 24
24 -
 25
25 -
 26
26 -
 27
27 -
 28
28 -
 29
29 -
 30
30 -
 31
31 -
 32
32 -
 33
33 -
 34
34 -
 35
35 -
36
-
37
-
38
-
39
-
40
-
41
-
42
-
43
-
44
-
45
-
46
-
47
-
48
-
49
-
50
-
51
-
52
-
53
-
54
-
55
-
56
-
57
-
58
-
59
-
60
-
61
-
62
-
63
-
64
-
65
-
66
 |
 |

23
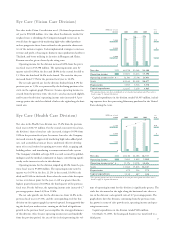
Hoya converts results of overseas subsidiaries from local curren-
cies to Japanese yen using the rate applicable to the period under
review. When compared to the results from previous periods, the
calculation will be affected by the difference in the exchange rate.
The U.S. dollar rate used for the period under review was ¥121.20
to one U.S. dollar, reflecting an appreciation of the yen of 3.7%
and pushing down results for the U.S. Group companies when
compared to the previous term. The euro rate of ¥121.48 to one
euro, however, reflected a depreciation of the yen of 9.5%, swelling
results from European subsidiaries enough to cover the falloff from
the U.S. and resulting in a net increase from the conversion differ-
ence. The gain on foreign exchange was ¥1,337 million of net sales.
Because this represents an increase of 0.6% from the previous fiscal
year, excluding this foreign exchange gain from the sales growth
rate for the fiscal year under review allows the actual growth rate
for the business to be calculated as 4.1%.
A year-on-year comparison of fiscal 2003 with the previous fiscal
year shows quarterly net sales up 1.5% in the first quarter, 6.4% in
the second, 8.0% in the third and 3.1% in the fourth. A quarter-
on-quarter comparison of fiscal 2003 with the immediately preced-
ing quarter shows a 2.4% increase in the first quarter, a 0.9% in-
crease in the second, a 0.2% decrease in the third, and nearly
unchanged in the fourth.
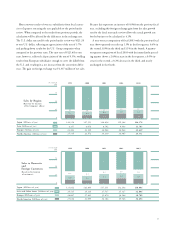
1999 2000 2001 2002 2003
(% of total)
Sales to Domestic
and
Foreign Customers
(Based on the location
of customers)
Japan (Millions of yen)
Asia and Other Areas (Millions of yen)
Europe (Millions of yen)
North America (Millions of yen)
100
75
50
25
0
123,062 126,844 137,211 132,248 138,006
24,525 24,326 27,537 25,127 32,806
28,067 27,841 35,870 38,144 38,789
25,636 22,099 36,184 39,746 36,692
63.1
12.1
13.8
11.0
56.0
13.3
15.8
14.9
56.2
10.7
16.2
16.9
57.9
11.6
15.2
15.3
61.1
12.2
14.0
12.7
100
75
50
25
0
144,516 147,553 168,856 159,368 166,178
8,357 8,076 8,792 9,948 11,705
23,303 23,109 24,944 28,964 32,639
25,114 22,372 34,210 36,985 35,771
73.4
4.0
11.5
11.1
67.5
4.8
13.2
14.5
67.8
4.2
12.3
15.7
71.3
3.7
10.5
14.5
71.8
4.1
11.6
12.5
1999 2000 2001 2002 2003
(% of total)
Sales by Region
Japan (Millions of yen)
Asia (Millions of yen)
Europe (Millions of yen)
North America (Millions of yen)
(Based on the location
of the Company’s offices)