Pentax 2003 Annual Report Download - page 55
Download and view the complete annual report
Please find page 55 of the 2003 Pentax annual report below. You can navigate through the pages in the report by either clicking on the pages listed below, or by using the keyword search tool below to find specific information within the annual report.-
 1
1 -
2
-
3
-
4
-
5
-
6
-
7
-
8
-
9
-
10
-
11
-
12
-
13
-
14
-
15
-
16
-
17
-
18
-
19
-
20
-
21
-
22
-
23
-
24
-
25
-
26
-
27
-
28
-
29
-
30
-
31
-
32
-
33
-
34
-
35
-
36
-
37
-
38
-
39
-
40
-
41
-
42
-
43
-
44
-
 45
45 -
 46
46 -
 47
47 -
 48
48 -
 49
49 -
 50
50 -
 51
51 -
 52
52 -
 53
53 -
 54
54 -
 55
55 -
 56
56 -
 57
57 -
 58
58 -
 59
59 -
 60
60 -
 61
61 -
 62
62 -
 63
63 -
 64
64 -
 65
65 -
66
 |
 |

53
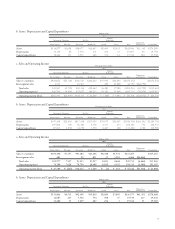
b. Assets, Depreciation and Capital Expenditures Millions of Yen
2003
Lifestyle
Information Technology Eye Care Refinement
Eliminations
Electro-Optics Photonics Vision Care Health Care Crystal Service Total and Corporate Consolidated
Assets ¥114,877 ¥2,698 ¥98,077 ¥16,447 ¥8,409 ¥2,432 ¥242,940 ¥31,349 ¥274,289
Depreciation 13,129 84 5,578 571 302 33 19,697 95 19,792
Capital expenditures 10,444 151 3,935 426 776 12 15,744 204 15,948
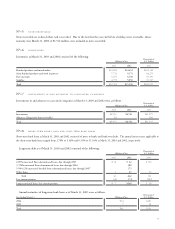
a. Sales and Operating Income Thousands of U.S. Dollars
2003
Lifestyle
Information Technology Eye Care Refinement
Eliminations
Electro-Optics Photonics Vision Care Health Care Crystal Service Total and Corporate Consolidated
Sales to customers $928,842 $45,708 $786,567 $222,642 $55,991 $12,692 $2,052,442 $2,052,442
Intersegment sales 1,725 16,567 292 25,208 43,792 $(43,792)
Total sales 930,567 45,708 803,134 222,642 56,283 37,900 2,096,234 (43,792) 2,052,442
Operating expenses 643,784 50,608 674,817 180,233 56,383 35,908 1,641,733 (30,816) 1,610,917
Operating income (loss) $286,783 $(4,900) $128,317 $042,409 $ (100) $01,992 $0,454,501 $(12,976) $0,441,525
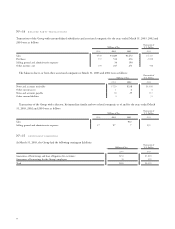
b. Assets, Depreciation and Capital Expenditures Thousands of U.S. Dollars
2003
Lifestyle
Information Technology Eye Care Refinement
Eliminations
Electro-Optics Photonics Vision Care Health Care Crystal Service Total and Corporate Consolidated
Assets $957,308 $22,483 $817,308 $137,059 $70,075 $20,267 $2,024,500 $261,242 $2,285,742
Depreciation 109,408 700 46,483 4,758 2,517 275 164,141 792 164,933
Capital expenditures 87,033 1,258 32,792 3,550 6,467 100 131,200 1,700 132,900
a. Sales and Operating Income Millions of Yen
2002
Lifestyle
Information Technology Eye Care Refinement
Eliminations
Electro-Optics Photonics Vision Care Health Care Crystal Service Total and Corporate Consolidated
Sales to customers ¥101,496 ¥7,157 ¥93,184 ¥23,106 ¥8,788 ¥1,534 ¥235,265 ¥235,265
Intersegment sales 481 29 811 35 3,110 4,466 ¥(4,466)
Total sales 101,977 7,157 93,213 23,917 8,823 4,644 239,731 (4,466) 235,265
Operating expenses 74,188 7,624 78,799 20,488 8,824 4,392 194,315 (2,948) 191,367
Operating income (loss) ¥027,789 ¥ (467) ¥14,414 ¥03,429 ¥ (1) ¥0,252 ¥045,416 ¥(1,518) ¥043,898
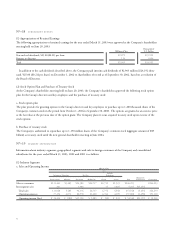
b. Assets, Depreciation and Capital Expenditures Millions of Yen
2002
Lifestyle
Information Technology Eye Care Refinement
Eliminations
Electro-Optics Photonics Vision Care Health Care Crystal Service Total and Corporate Consolidated
Assets ¥111,806 ¥4,515 ¥92,309 ¥15,816 ¥8,684 ¥3,445 ¥236,575 ¥41,493 ¥278,068
Depreciation 12,687 227 5,516 554 498 37 19,519 117 19,636
Capital expenditures 13,280 53 5,259 687 254 1 19,534 51 19,585