Pentax 2003 Annual Report Download - page 30
Download and view the complete annual report
Please find page 30 of the 2003 Pentax annual report below. You can navigate through the pages in the report by either clicking on the pages listed below, or by using the keyword search tool below to find specific information within the annual report.-
 1
1 -
2
-
3
-
4
-
5
-
6
-
7
-
8
-
9
-
10
-
11
-
12
-
13
-
14
-
15
-
16
-
17
-
18
-
19
-
 20
20 -
 21
21 -
 22
22 -
 23
23 -
 24
24 -
 25
25 -
 26
26 -
 27
27 -
 28
28 -
 29
29 -
 30
30 -
 31
31 -
 32
32 -
 33
33 -
 34
34 -
 35
35 -
 36
36 -
 37
37 -
 38
38 -
 39
39 -
 40
40 -
41
-
42
-
43
-
44
-
45
-
46
-
47
-
48
-
49
-
50
-
51
-
52
-
53
-
54
-
55
-
56
-
57
-
58
-
59
-
60
-
61
-
62
-
63
-
64
-
65
-
66
 |
 |

28
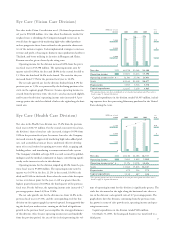
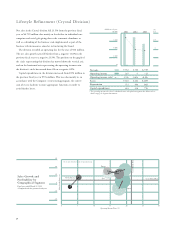
Lifestyle Refinement (Crystal Division)
Net sales in the Crystal division fell 23.5% from the previous fiscal
year to ¥6,719 million, due mainly to the decline in individual con-
sumption and social gift-giving due to the economic slowdown, as
well as a shrinking of the business scale implemented as part of the
business reform measures aimed at restructuring the brand.
The division recorded an operating loss for the year of ¥12 million.
The net sales growth ratio fell further from a negative 11.6% in the
previous fiscal year to a negative 23.5%. The position on the graph of
the circle representing this division has moved down the vertical axis,
and on the horizontal axis representing the operating income ratio,
the division’s circle has moved from 0% to a negative 0.2%.
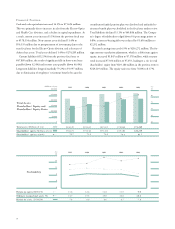
Capital expenditures in the division increased from ¥254 million in
the previous fiscal year to ¥776 million. This was due mainly to, in
accordance with the Company’s restructuring program, the conver-
sion of excess facilities to more appropriate functions, in order to
avoid further losses.
28
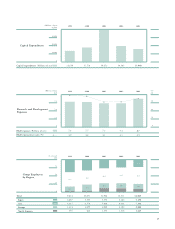
0
7,500
5,000
2,500
10,000 4.0
2.0
0
9,942 8,788 6,719
285
2.9%
-1
-0.0%
-12
-0.2%
9,828 8,684 8,409
552
610
498
254
302
776
(%)
2001 2002 2003
(Millions of yen)
Net sales
Operating income
Operating income ratio*
Assets
Depreciation
Capital expenditures
*The operating income ratio above is calculated on net sales plus intersegment sales. Please refer to
details on page 52 Segment Information.
20
30
10
0
-10
-20
05101520 25 30
Sales Growth Ratio (%)
Operating Income Ratio (%)
North America Asia
Europe
Japan
Consolidated Basis
Sales Growth and
Profitability by
Geographical Segment
Fiscal year ended March 31, 2003
(Compared with the previous fiscal year)
Size of circle shows the volume of operating income.
Consolidated Basis