Pentax 2003 Annual Report Download - page 26
Download and view the complete annual report
Please find page 26 of the 2003 Pentax annual report below. You can navigate through the pages in the report by either clicking on the pages listed below, or by using the keyword search tool below to find specific information within the annual report.-
 1
1 -
2
-
3
-
4
-
5
-
6
-
7
-
8
-
9
-
10
-
11
-
12
-
13
-
14
-
15
-
 16
16 -
 17
17 -
 18
18 -
 19
19 -
 20
20 -
 21
21 -
 22
22 -
 23
23 -
 24
24 -
 25
25 -
 26
26 -
 27
27 -
 28
28 -
 29
29 -
 30
30 -
 31
31 -
 32
32 -
 33
33 -
 34
34 -
 35
35 -
 36
36 -
37
-
38
-
39
-
40
-
41
-
42
-
43
-
44
-
45
-
46
-
47
-
48
-
49
-
50
-
51
-
52
-
53
-
54
-
55
-
56
-
57
-
58
-
59
-
60
-
61
-
62
-
63
-
64
-
65
-
66
 |
 |

24
Net Income
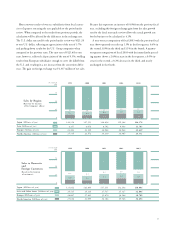
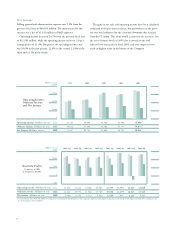
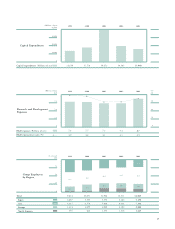
Selling, general and administrative expenses rose 5.1% from the
previous fiscal year to ¥60,035 million. The main reason for this
increase was a rise of ¥1,332 million in R&D expenses.
Operating income increased 20.7% from the previous fiscal year
to ¥52,983 million, while the operating income ratio rose 2.8 per-
centage points to 21.5%. By quarter, the operating income ratio
was 20.6% in the first quarter, 22.6% in the second, 21.8% in the
third and 21.1% in the fourth.
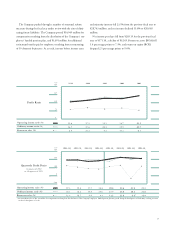
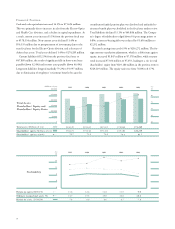
The gains in net sales and operating income have been calculated
compared to the previous fiscal year, but performance in the previ-
ous year was lackluster due the economic downturn that resulted
from the IT slump. This alone would account for the increases, but
the rate of returns for fiscal 2003 also recovered to the level
achieved two years prior in fiscal 2001, and even surpassed it to
reach its highest value in the history of the Company.
60,000
45,000
30,000
15,000
0
31,726 34,688 45,128 43,898 52,983
33,612 35,484 48,184 45,774 50,874
17,837 20,716 21,860 23,741 20,038
1999 2000 2001 2002 2003
Operating Income,
Ordinary Income
and Net Income
Operating Income (Millions of yen)
Ordinary Income (Millions of yen)
Net Income (Millions of yen)
(Millions of yen)
(Millions of yen)
Operating income (Millions of yen)
Ordinary income (Millions of yen)
Net income (Millions of yen)
Quarterly Profits
1st quarter of 2002
to 4th quarter of 2003
13,95112,599 13,433 13,00011,23411,613 10,068 10,983
14,17910,848 12,435 13,41210,57312,124 11,368 11,709
7,9776,869 -2,125*7,3176,1927,468 5,142 4,939
2002-4Q2002-3Q2002-2Q2002-1Q
15,000
10,000
5,000
0
-5,000
2003-4Q2003-3Q2003-2Q2003-1Q
* An extraordinary loss of ¥14,949 million for compensation resulting from the dissolution of the Company’s employees’ funded pension plan was posted during the third quarter of fiscal 2003, resulting in a net
loss for the quarter of ¥2,125 million.