Pentax 2003 Annual Report Download - page 29
Download and view the complete annual report
Please find page 29 of the 2003 Pentax annual report below. You can navigate through the pages in the report by either clicking on the pages listed below, or by using the keyword search tool below to find specific information within the annual report.-
 1
1 -
2
-
3
-
4
-
5
-
6
-
7
-
8
-
9
-
10
-
11
-
12
-
13
-
14
-
15
-
16
-
17
-
18
-
 19
19 -
 20
20 -
 21
21 -
 22
22 -
 23
23 -
 24
24 -
 25
25 -
 26
26 -
 27
27 -
 28
28 -
 29
29 -
 30
30 -
 31
31 -
 32
32 -
 33
33 -
 34
34 -
 35
35 -
 36
36 -
 37
37 -
 38
38 -
 39
39 -
40
-
41
-
42
-
43
-
44
-
45
-
46
-
47
-
48
-
49
-
50
-
51
-
52
-
53
-
54
-
55
-
56
-
57
-
58
-
59
-
60
-
61
-
62
-
63
-
64
-
65
-
66
 |
 |

27
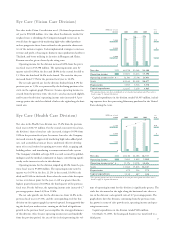
Eye Care (Vision Care Division)
Eye Care (Health Care Division)
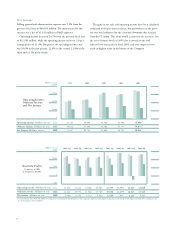
Net sales in the Health Care division rose 15.6% from the previous
fiscal year to ¥26,717 million. For the second consecutive fiscal year,
the division’s share of total net sales increased, rising to 10.9% from
9.8% in the previous fiscal year. In contact lens sales, the Company
increased revenue by aggressively marketing high-value-added prod-
ucts such as multifocal contact lenses, undertook effective develop-
ment of its retail outlets by opening new stores while scrapping and
building others, and introducing a customer-oriented sales system.
The Company’s foldable soft-type IOL was well received by ophthal-
mologists and the medical community in Japan, contributing signifi-
cantly to the increase in sales in this division.
Operating income for the division jumped up 48.4% from the pre-
vious fiscal year to ¥5,089 million. The operating income ratio by
quarter was 16.5% in the first, 21.2% in the second, 18.6% in the
third and 19.6% in the fourth. Even when the ratio of the first quar-
ter was at its lowest point for the year, it still was greater than the
highest quarterly ratio of 16.0% in the third quarter of the previous
fiscal year. For the full year, the operating income ratio increased 4.7
percentage points, from 14.3% to 19.0%.
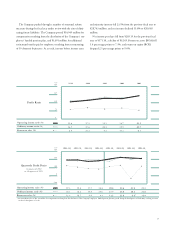
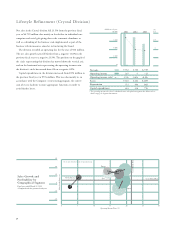
The net sales growth rate for the division rose from 14.8% in the
previous fiscal year to 15.6%, and the corresponding circle for this
division on the segment graph has moved upward. Strong growth dur-
ing the fiscal year under review, coming on the back of significant
growth in the previous fiscal year exemplifies the strong performance
of this division. Also, because operating income increased markedly
from the previous period, the area of the circle (representing the vol-
ume of operating income) for this division is significantly greater. The
circle has also moved to the right along the horizontal axis, due to a
rise in the division’s sales growth ratio of 4.7 percentage points. The
graph shows how this division, continuing from the previous term,
has grown in terms of sales growth ratio, operating income and oper-
ating income ratio.
Capital expenditures in the division totaled ¥426 million.
On March 31, 2003, the hearing aid business was transferred to a
third party.
2001 2002 2003
(Millions of yen) (%)
Net sales
Operating income
Operating income ratio*
Assets
Depreciation
Capital expenditures
*The operating income ratio above is calculated on net sales plus intersegment sales. Please refer to
details on page 52 Segment Information.
0
75,000
50,000
25,000
100,000 20.0
10.0
0
86,198 93,184 94,388
10,601
12.3%
14,414
15.5%
15,398
16.0%
83,343 92,309 98,077
5,987
22,287
5,516
5,259
5,578
3,935
(%)
(Millions of yen)
Net sales
Operating income
Operating income ratio*
Assets
Depreciation
Capital expenditures
*The operating income ratio above is calculated on net sales plus intersegment sales. Please refer to
details on page 52 Segment Information.
0
22,500
15,000
7,500
30,000 20.0
10.0
0
20,130 23,106 26,717
2,405
11.1%
3,429
14.3%
5,089
19.0%
2001 2002 2003
13,366 15,816 16,447
479
1,138
554
687
571
426
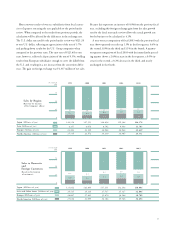
Net sales in the Vision Care division rose 1.3% from the previous fis-
cal year to ¥94,388 million. At a time when the domestic market for
eyeglass lenses is shrinking, the Company managed to increase its
overall share by aggressively marketing high-value-added products
such as progressive focus lenses tailored to the particular characteris-
tics of the nation or region. It also implemented strategies to increase
revenue and profit, relocating its domestic mass-production facility to
Thailand, and better utilizing its factories in Hungary and China.
Revenue was also given a boost by the rising euro.
Operating income for the division increased 6.8% from the previ-
ous fiscal year to ¥15,398 million. The operating income ratio by
quarter raised 16.8% in the first and 18.0% in the second, but fell to
13.1% in the third and 16.0% in the fourth. The ratio for the year
increased from 15.5% for the previous fiscal year to 16.0%.
The net sales growth rate for the division declined from 8.1% the
previous year to 1.3%, as represented by the declining position of its
circle on the segment graph. However, because operating income in-
creased from the previous term, the circle’s area has increased slightly,
and because the division’s operating income ratio increased 0.5 per-
centage points the circle has shifted a little to the right along the hori-
zontal axis.
Capital expenditures in the division totaled ¥3,935 million, includ-
ing expenses for a lens processing laboratory purchased in the United
States during the term.