Pentax 2003 Annual Report Download - page 28
Download and view the complete annual report
Please find page 28 of the 2003 Pentax annual report below. You can navigate through the pages in the report by either clicking on the pages listed below, or by using the keyword search tool below to find specific information within the annual report.-
 1
1 -
2
-
3
-
4
-
5
-
6
-
7
-
8
-
9
-
10
-
11
-
12
-
13
-
14
-
15
-
16
-
17
-
 18
18 -
 19
19 -
 20
20 -
 21
21 -
 22
22 -
 23
23 -
 24
24 -
 25
25 -
 26
26 -
 27
27 -
 28
28 -
 29
29 -
 30
30 -
 31
31 -
 32
32 -
 33
33 -
 34
34 -
 35
35 -
 36
36 -
 37
37 -
 38
38 -
39
-
40
-
41
-
42
-
43
-
44
-
45
-
46
-
47
-
48
-
49
-
50
-
51
-
52
-
53
-
54
-
55
-
56
-
57
-
58
-
59
-
60
-
61
-
62
-
63
-
64
-
65
-
66
 |
 |

26
Information Technology (Electro-Optics Division)
Review by Segment
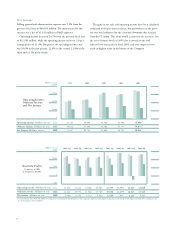
Net sales in the Information Technology field increased 7.6% from
the previous fiscal year to ¥116,946 million. This was due mainly to a
9.8% increase in sales by the Electro-Optics division to ¥111,461 mil-
lion. Sales by product group are as follows. In mask blanks for the
manufacture of semiconductors, sales of high-precision products in-
creased. In photomasks for semiconductor manufacture, although the
domestic market tended toward decline, the shift to high-precision
products and a larger percentage of overseas sales kept overall sales on
par with the previous year. In LCD photomasks, increasing demand,
especially for large photomasks, resulted in rising sales. In glass disks
for HDDs, sales of media products (glass substrates coated with a
magnetic layer) rose following increased shipments of HDDs, while
sales of substrates (glass substrates, the polished glass disks) remained
flat, leading to an overall decline in revenue. In optical glass products,
sales of lenses for digital cameras and video recorders recovered from
the inventory adjustment phase that characterized the previous fiscal
year, and revenue increased. In laser products from the Photonics di-
vision, as part of the Company’s restructuring plan, the section han-
dling physical- and chemical-use lasers in the Photonics division was
sold off in October, resulting in a decline in sales from the previous
fiscal year.
Operating income for the Information Technology field increased
23.8% from the previous fiscal year to ¥33,826 million. The operat-
ing income ratio for the Electro-Optics division was 29.2% in the
first quarter, 31.8% in the second, 32.8% in the third, and 29.4% in
the fourth, rising for each corresponding quarter of the previous fiscal
year, and from 27.3% in the previous term to 30.8% for the full fiscal
year. This was the principal reason for the notable rise in the operat-
ing income ratio for the Information Technology field.
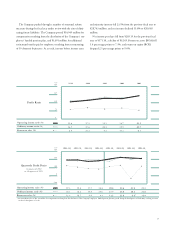
The Electro-Optics division’s net sales growth rate improved to a
positive 9.8% from a negative 9.7% for the previous year. The graph
labeled “Sales Growth and Profitability by Business Segment” on this
page shows that the position of the circle representing this segment
has moved up the vertical axis, (which shows the net sales growth
rate) to a level above the Company’s consolidated total of 4.7%. Due
to an increase of 3.5 percentage points in the operating income ratio,
moreover, the circle representing the segment has moved in a positive
direction to the right along the horizontal axis (representing the oper-
ating income ratio). During the period under review, this segment was
able to recovery significantly the declines of the previous fiscal year,
and even surpass former levels.
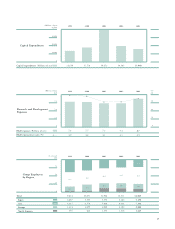
Capital expenditures for the Electro-Optics division were reduced
by 21.4% to ¥10,444 million, the result of planned investments being
held over to the next fiscal period. As a result, capital expenditures for
the Information Technology field totaled ¥10,595 million. This rep-
resents 66.4% of investment for the entire Group, down 1.7 percent-
age points from the previous fiscal year.
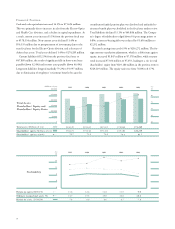
0
90,000
60,000
30,000
120,000
(%)
40.0
20.0
0
112,341 101,496 111,461
34,815
30.8%
27,789
27.3%
34,414
30.8%
2001 2002 2003
112,257 111,806 114,877
10,299
15,230
12,687
13,280
13,129
10,444
(Millions of yen)
Net sales
Operating income
Operating income ratio
Assets
Depreciation
Capital expenditures
Notes: 1. The operating income ratio above is calculated on net sales plus intersegment sales. Please
refer to details on page 52 Segment Information.
2. Data above doesn’t include Photonics division.
20
30
10
0
-10
-20
1002030
Sales Growth and
Profitability by
Business Segment
Fiscal year ended March 31, 2003
(Compared with the previous fiscal year)
Vision Care
Size of circle shows the volume of operating income.
Health Care
Crystal
Electro-Optics
Sales Growth Ratio (%)
Operating Income Ratio (%)
Consolidated Basis
Consolidated Basis