Pentax 2003 Annual Report Download - page 31
Download and view the complete annual report
Please find page 31 of the 2003 Pentax annual report below. You can navigate through the pages in the report by either clicking on the pages listed below, or by using the keyword search tool below to find specific information within the annual report.-
 1
1 -
2
-
3
-
4
-
5
-
6
-
7
-
8
-
9
-
10
-
11
-
12
-
13
-
14
-
15
-
16
-
17
-
18
-
19
-
20
-
 21
21 -
 22
22 -
 23
23 -
 24
24 -
 25
25 -
 26
26 -
 27
27 -
 28
28 -
 29
29 -
 30
30 -
 31
31 -
 32
32 -
 33
33 -
 34
34 -
 35
35 -
 36
36 -
 37
37 -
 38
38 -
 39
39 -
 40
40 -
 41
41 -
42
-
43
-
44
-
45
-
46
-
47
-
48
-
49
-
50
-
51
-
52
-
53
-
54
-
55
-
56
-
57
-
58
-
59
-
60
-
61
-
62
-
63
-
64
-
65
-
66
 |
 |
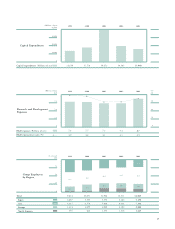
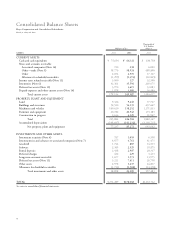
2929
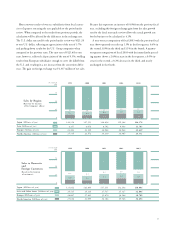
40,000
30,000
20,000
10,000
0
20032002200120001999
13,654 17,770 39,673 19,585 15,948
(Millions of yen)
Capital Expenditures
Capital expenditures (Millions of yen)
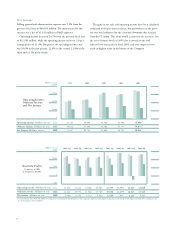
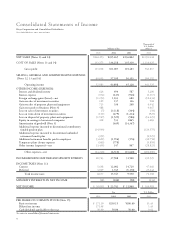
10.0
7.5
5.0
2.5
0
20032002200120001999
7.8 7.7 7.3 7.3 8.7
4.0
3.0
1.0
0
2.0
3.9 3.8 3.1 3.1 3.5
(Billions of yen) (%)
R&D expenses (Billions of yen)
R&D expenses/net sales (%)
Research and Development
Expenses
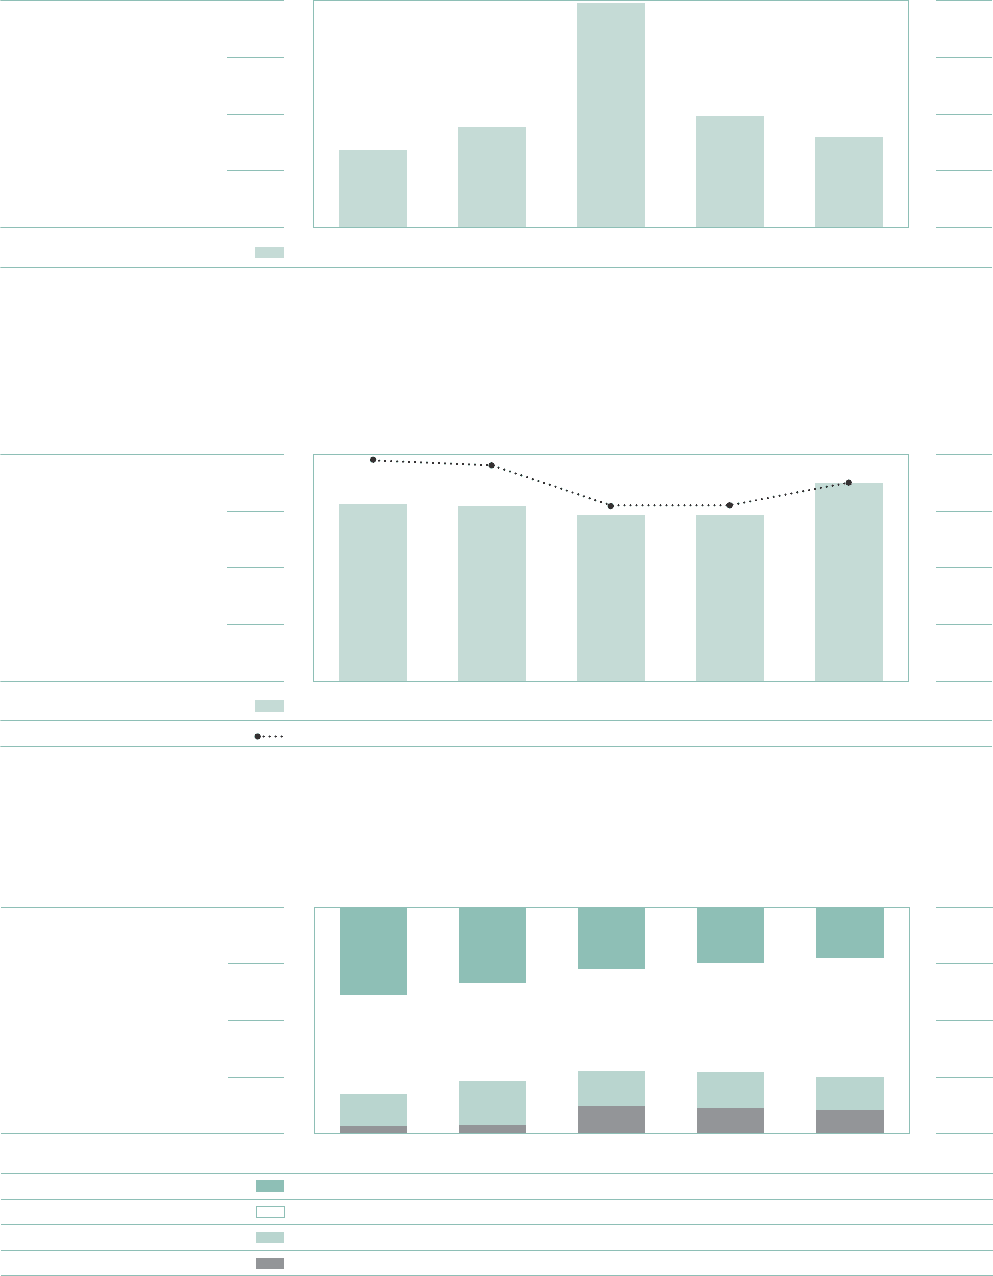
100
75
50
25
0
9,414 10,651 12,966 13,311 14,023
3,667 3,595 3,553 3,282 3,150
4,117 4,579 5,838 6,411 7,346
1,314
316
2,055 2,000 2,102 2,082
422 1,575 1,516 1,445
1999 2000 2001 2002 2003
33.8
43.0
19.3
3.9
22.5
52.4
14.8
10.3
24.7
48.2
15.8
11.3
27.4
45.0
15.4
12.2
39.0
43.7
14.0
3.3
Group Employees
by Region
(% of total)
Total
Japan
Asia
Europe
North America