Pentax 2003 Annual Report Download - page 24
Download and view the complete annual report
Please find page 24 of the 2003 Pentax annual report below. You can navigate through the pages in the report by either clicking on the pages listed below, or by using the keyword search tool below to find specific information within the annual report.-
 1
1 -
2
-
3
-
4
-
5
-
6
-
7
-
8
-
9
-
10
-
11
-
12
-
13
-
 14
14 -
 15
15 -
 16
16 -
 17
17 -
 18
18 -
 19
19 -
 20
20 -
 21
21 -
 22
22 -
 23
23 -
 24
24 -
 25
25 -
 26
26 -
 27
27 -
 28
28 -
 29
29 -
 30
30 -
 31
31 -
 32
32 -
 33
33 -
 34
34 -
35
-
36
-
37
-
38
-
39
-
40
-
41
-
42
-
43
-
44
-
45
-
46
-
47
-
48
-
49
-
50
-
51
-
52
-
53
-
54
-
55
-
56
-
57
-
58
-
59
-
60
-
61
-
62
-
63
-
64
-
65
-
66
 |
 |

22
Management’s Discussion and Analysis
Scope of Consolidation
The Hoya Group includes Hoya Corporation and its 52 consoli-
dated subsidiaries (six domestic and 46 overseas), as well as six do-
mestic affiliates, two of which are accounted for by the equity
method.
The number of consolidated subsidiaries increased by one during
the year under review. This increase is the result of the establish-
ment of two new companies and the acquisition of a third compa-
ny, and the merger of two existing subsidiaries with Hoya Corpora-
tion. The number of affiliates is unchanged.
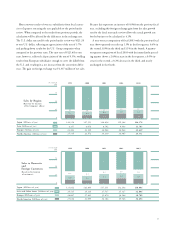
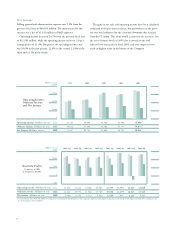
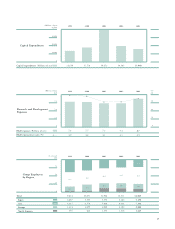
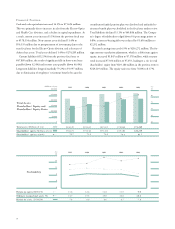
Net Sales
Consolidated net sales for the year ended March 31, 2003 in-
creased 4.7% from the previous fiscal year to ¥246,293 million.
This was due mainly to a rise of 9.8% in sales in the Information
Technology field’s Electro-Optics division, and a significant sales
increase of 15.6% at the Health Care division of the Eye Care
field. The Vision Care division also reported a slight increase in sales.
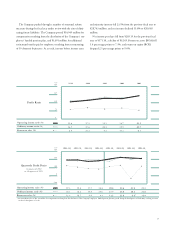
Domestic sales increased 4.4% from the previous fiscal year to
¥138,006 million, and overseas sales rose 5.1% to ¥108,287 mil-
lion. This represents a domestic share of 56.0% of total net sales,
and a 44.0% share from overseas. The overseas share increased 0.2
percentage points, as the previous year’s ratios were 56.2% for do-
mestic and 43.8% for overseas.
(% of total)
Sales
by Business Segment
Electro-Optics (Millions of yen)
Photonics (Millions of yen)
Vision Care (Millions of yen)
Health Care (Millions of yen)
Crystal (Millions of yen)
Service (Millions of yen)
100
75
50
25
0
86,943 90,174 112,341 101,496 111,461
8,793 7,248 6,534 7,157 5,485
69,858 71,754 86,198 93,184 94,388
19,552 19,541 20,130 23,106 26,717
12,267 10,516 9,942 8,788 6,719
3,877 1,877 1,657 1,534 1,523
44.9
3.6
35.7
9.7
5.2
0.9
45.3
2.2
38.3
10.9
2.7
0.6
43.2
4.4
34.7
9.7
6.1
1.9
43.1
3.1
39.6
9.8
3.7
0.7
47.4
2.8
36.4
8.5
4.2
0.7
20032000 2001 20021999
300,000
225,000
150,000
75,000
0
201,290 201,110 236,802 235,265 246,293
(Millions of yen)
Net sales
Net sales (Millions of yen)
1999 2000 2001 2002 2003