Pentax 2003 Annual Report Download - page 32
Download and view the complete annual report
Please find page 32 of the 2003 Pentax annual report below. You can navigate through the pages in the report by either clicking on the pages listed below, or by using the keyword search tool below to find specific information within the annual report.-
 1
1 -
2
-
3
-
4
-
5
-
6
-
7
-
8
-
9
-
10
-
11
-
12
-
13
-
14
-
15
-
16
-
17
-
18
-
19
-
20
-
21
-
 22
22 -
 23
23 -
 24
24 -
 25
25 -
 26
26 -
 27
27 -
 28
28 -
 29
29 -
 30
30 -
 31
31 -
 32
32 -
 33
33 -
 34
34 -
 35
35 -
 36
36 -
 37
37 -
 38
38 -
 39
39 -
 40
40 -
 41
41 -
 42
42 -
43
-
44
-
45
-
46
-
47
-
48
-
49
-
50
-
51
-
52
-
53
-
54
-
55
-
56
-
57
-
58
-
59
-
60
-
61
-
62
-
63
-
64
-
65
-
66
 |
 |

30
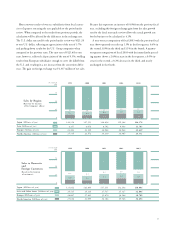
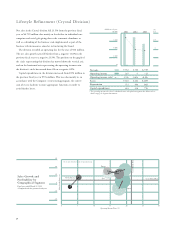
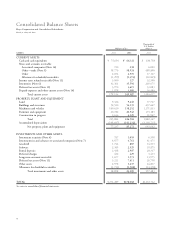
Financial Position
Cash and cash equivalents increased 14.1% to ¥75,694 million.
This was primarily due to increases in sales from the Electro-Optics
and Health Care divisions, and a decline in capital expenditures. As
a result, current assets increased 5.1% from the previous fiscal year
to ¥178,154 million. Non-current assets declined 11.4% to
¥96,135 million due to postponement of investment plans to the
next fiscal year for the Electro-Optics division, and a decrease of
deferred tax assets. Total assets declined 1.4% to ¥274,289 million.
Current liabilities fell 2.5% from the previous fiscal year to
¥47,889 million, the result of significant falls in short-term loans
payable (down 32.4%) and income taxes payable (down 46.4%).
Long-term liabilities dropped markedly 79.2% to ¥1,997 million,
due to elimination of employees’ retirement benefits because the
contributory funded pension plan was dissolved and unfunded re-
tirement benefit plan was abolished in the fiscal year under review.
Total liabilities declined 15.1% to ¥49,886 million. The Compa-
ny’s degree of indebtedness edged down 0.6 percentage points to
0.8%, as interest-bearing debt was reduced by ¥1,656 million to
¥2,292 million.
Retained earnings increased 6.9% to ¥216,272 million. The for-
eign currency translation adjustment, which is a debit item against
equity, increased ¥1,847 million to ¥7,178 million, while treasury
stock increased ¥7,036 million to ¥7,053, leading to a rise in total
shareholders’ equity from ¥219,180 million in the previous term to
¥224,219 million. The equity ratio rose from 78.8% to 81.7%.
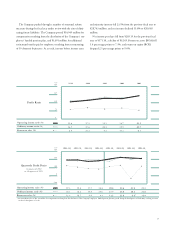
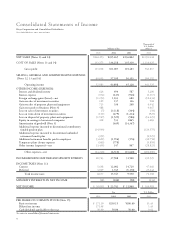
Total assets (Millions of yen)
Shareholders’ equity (Millions of yen)
Shareholders’ equity ratio(%)
300,000
200,000
250,000
150,000
100,000
50,000
0
20032002200120001999
Total Assets,
Shareholders’ Equity and
Shareholders’ Equity Ratio
(%)
70.7 73.2 73.0 78.8 81.7
224,335 239,341 267,611
158,473
278,068
219,180175,146 195,333
274,289
224,219
85
75
80
70
65
60
(Millions of yen)
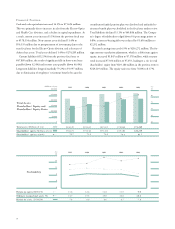
Return on equity [ROE](%)
Ordinary income/total assets (%)
Return on assets [ROA](%)
20
12
16
8
4
0
(%)
20032002200120001999
11.6 12.4 11.8 11.5 9.0
14.7 15.3 19.0 16.8 18.4
7.8 8.9 8.6 8.7 7.3
Profitability