Pentax 2002 Annual Report Download - page 52
Download and view the complete annual report
Please find page 52 of the 2002 Pentax annual report below. You can navigate through the pages in the report by either clicking on the pages listed below, or by using the keyword search tool below to find specific information within the annual report.-
 1
1 -
2
-
3
-
4
-
5
-
6
-
7
-
8
-
9
-
10
-
11
-
12
-
13
-
14
-
15
-
16
-
17
-
18
-
19
-
20
-
21
-
22
-
23
-
24
-
25
-
26
-
27
-
28
-
29
-
30
-
31
-
32
-
33
-
34
-
35
-
36
-
37
-
38
-
39
-
40
-
41
-
 42
42 -
 43
43 -
 44
44 -
 45
45 -
 46
46 -
 47
47 -
 48
48 -
 49
49 -
 50
50 -
 51
51 -
 52
52 -
 53
53 -
 54
54 -
 55
55 -
 56
56 -
 57
57 -
 58
58 -
 59
59 -
 60
60
 |
 |

50
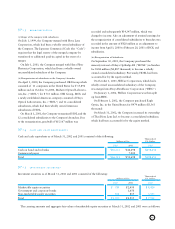
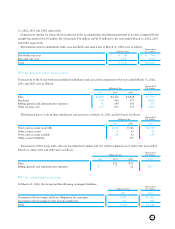
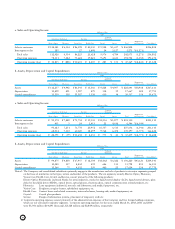
(2) Geographical Segments
The geographical segments of the Company and consolidated subsidiaries for the years ended March 31, 2002, 2001 and 2000
are summarized as follows:
Millions of Yen
2002
Eliminations
Japan North America Europe Asia Total and Corporate Consolidated
Sales to customers ¥159,368 ¥36,985 ¥28,964 ¥9,948 ¥235,265 ¥235,265
Interarea transfers 14,964 113 1,196 40,330 56,603 ¥(56,603)
Total sales 174,332 37,098 30,160 50,278 291,868 (56,603) 235,265
Operating expenses 143,426 35,139 25,918 43,109 247,592 (56,225) 191,367
Operating income ¥30,906 ¥1,959 ¥4,242 ¥7,169 ¥44,276 ¥(378) ¥43,898
Assets ¥138,963 ¥21,000 ¥30,356 ¥55,412 ¥245,731 ¥32,337 ¥278,068
Thousands of U.S. Dollars
2002
Eliminations
Japan North America Europe Asia Total and Corporate Consolidated
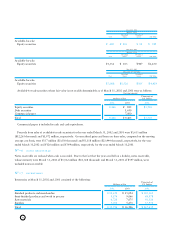
Sales to customers $ 1,198,256 $ 278,083 $ 217,774 $ 74,797 $ 1,768,910 $ 1,768,910
Interarea transfers 112,511 849 8,993 303,233 425,586 $(425,586)
Total sales 1,310,767 278,932 226,767 378,030 2,194,496 (425,586) 1,768,910
Operating expenses 1,078,391 264,203 194,872 324,128 1,861,594 (422,744) 1,438,850
Operating income $ 232,376 $ 14,729 $ 31,895 $ 53,902 $ 332,902 $ (2,842)$ 330,060
Assets $ 1,044,835 $ 157,895 $ 228,241 $416,631 $ 1,847,602 $243,135 $ 2,090,737
Millions of Yen
2001
Eliminations
Japan North America Europe Asia Total and Corporate Consolidated
Sales to customers ¥168,856 ¥34,210 ¥24,944 ¥8,792 ¥236,802 ¥236,802
Interarea transfers 17,928 548 893 39,237 58,606 ¥(58,606)
Total sales 186,784 34,758 25,837 48,029 295,408 (58,606) 236,802
Operating expenses 150,991 34,295 22,811 41,131 249,228 (57,554) 191,674
Operating income ¥35,793 ¥463 ¥3,026 ¥6,898 ¥46,180 ¥(1,052) ¥45,128
Assets ¥139,320 ¥21,073 ¥27,000 ¥48,144 ¥235,537 ¥32,074 ¥267,611
Millions of Yen
2000
Eliminations
Japan North America Europe Asia Total and Corporate Consolidated
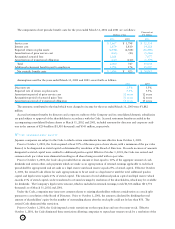
Sales to customers ¥147,553 ¥22,372 ¥23,109 ¥8,076 ¥201,110 ¥201,110
Interarea transfers 18,123 204 626 29,967 48,920 ¥(48,920)
Total sales 165,676 22,576 23,735 38,043 250,030 (48,920) 201,110
Operating expenses 138,465 21,971 20,140 33,519 214,095 (47,673) 166,422
Operating income ¥27,211 ¥605 ¥3,595 ¥4,524 ¥35,935 ¥(1,247) ¥34,688
Assets ¥127,775 ¥15,255 ¥23,101 ¥39,188 ¥205,319 ¥34,022 ¥239,341
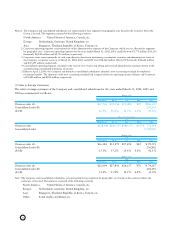
3. Corporate assets consist primarily of cash, time deposits, short-term investments, investments securities and administrative assets of
the Company and the two foreign holding companies. Corporate assets as of March 31, 2002, 2001 and 2000 were ¥51,632 million
($388,211 thousand), ¥47,211 million and ¥49,867 million, respectively.
4. Consolidated operating expenses are equal to the total of cost of sales and selling, general and administrative expenses shown in the
accompanying consolidated statements of income.
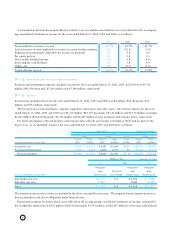
5. Effective April 1, 2000, the Company and domestic consolidated subsidiaries adopted a new accounting standard for employees’
retirement benefits. The adoption of the new accounting standard had a negative effect on operating income as follows: Electro-
Optics, Vision Care, Health Care, Crystal, Service and Corporate of ¥544 million, ¥440 million, ¥166 million, ¥158 million, ¥112
million and ¥100 million, respectively.