Pentax 2002 Annual Report Download - page 22
Download and view the complete annual report
Please find page 22 of the 2002 Pentax annual report below. You can navigate through the pages in the report by either clicking on the pages listed below, or by using the keyword search tool below to find specific information within the annual report.-
 1
1 -
2
-
3
-
4
-
5
-
6
-
7
-
8
-
9
-
10
-
11
-
 12
12 -
 13
13 -
 14
14 -
 15
15 -
 16
16 -
 17
17 -
 18
18 -
 19
19 -
 20
20 -
 21
21 -
 22
22 -
 23
23 -
 24
24 -
 25
25 -
 26
26 -
 27
27 -
 28
28 -
 29
29 -
 30
30 -
 31
31 -
 32
32 -
33
-
34
-
35
-
36
-
37
-
38
-
39
-
40
-
41
-
42
-
43
-
44
-
45
-
46
-
47
-
48
-
49
-
50
-
51
-
52
-
53
-
54
-
55
-
56
-
57
-
58
-
59
-
60
 |
 |

20
1998 1999 2000 2001 2002
240,000
160,000
120,000
80,000
40,000
0
(Millions of yen)
200,000
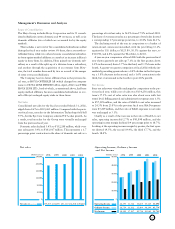
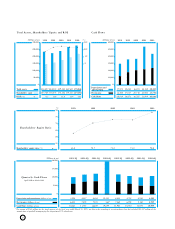
Net sales
Net sales
(Millions of yen)
193,473 201,290 201,110 236,802 235,265
1998 1999 2000 2001 2002
50,000
0
10,000
20,000
30,000
40,000
(Millions of yen)
Operating Income, Ordinary Income
and Net Income
Operating Income
Ordinary Income
Net Income
26,395
26,759
12,348
31,726
33,612
17,837
34,688
35,484
20,716
45,128
48,184
21,860
43,898
45,774
23,741
Management's Discussion and Analysis
Scope of Consolidation
The Hoya Group includes Hoya Corporation and its 51 consoli-
dated subsidiaries (seven domestic and 44 overseas), as well as six
domestic affiliates (two of which are accounted for by the equity
method).
This includes a net total of five consolidated subsidiaries added
during the fiscal year under review. Of these, three are newly es-
tablished firms, while two others became consolidated subsidiar-
ies from equity-method affiliates as a result of an increase in Hoya’s
equity in those firms. In addition, Hoya gained one domestic sub-
sidiary as a result of the split-up of a division from a subsidiary,
and another through the acquisition of an overseas firm. How-
ever, the total number decreased by two as a result of the merger
of some overseas subsidiaries.
The Company has two fewer affiliates than in the previous fis-
cal year, as HOYA-OPTIKSLIP AB (which changed its company
name to HOYA LENS SWEDEN AB in April, 2002) and THAI
HOYA LENS LTD., both of which, as mentioned above, had been
equity-method affiliates, became consolidated subsidiaries as a re-
sult of Hoya’s enlarged equity stake in those firms.
Net Sales
Consolidated net sales for the fiscal year ended March 31, 2002,
edged down 0.6% to ¥235,265 million. Compared with the previ-
ous fiscal year, net sales in the Information Technology field fell
9.7%, but the Eye Care Company achieved 9.4% sales growth. As
a result, total net sales for the Group were virtually unchanged
from the previous fiscal year.
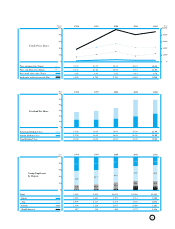
Domestic sales declined 3.6% to ¥132,248 million, while over-
seas sales grew 3.4% to ¥103,017 million. This represents a 1.7
percentage point contraction in the share of domestic net sale as a
percentage of total net sales, to 56.2% from 57.9% in fiscal 2001.
The share of overseas net sales as a percentage of total sales showed
a corresponding 1.7 percentage point rise, to 43.8% from 42.1%.
The declining trend of the yen in comparison to a basket of
international currencies intensified, with the yen falling 13.2%
against the U.S. dollar, to ¥125.89, 10.5% against the euro, to
¥110.98, and 6.8% against the Thai baht, to ¥2.83.
A year-on-year comparison of fiscal 2002 with the previous fiscal
year shows quarterly net sales up 7.1% in the first quarter, down
2.2% in the second, down 5.7% in the third, and 1.3% lower in the
fourth. A quarter-on-quarter comparison of fiscal 2002 with the im-
mediately preceding quarter shows a 0.4% decline in the first quar-
ter, a 3.8% decrease in the second, and a 1.6% contraction in the
third, but a turnaround in the fourth to post 4.8% growth.
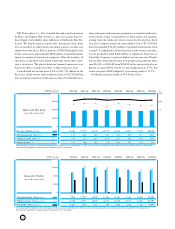
Net Income
Since net sales were virtually unchanged in comparison to the pre-
vious fiscal year, while cost of sales was ¥134,258 million, this
term’s 57.1% cost of sales ratio was also about even with last
term’s level. Selling, general and administrative expenses rose 1.3%
to ¥57,109 million, and the ratio of SG&A to net sales increased
to 24.3% from 23.8% in the previous fiscal year. R&D expenses
were ¥7,289 million, and the ratio of R&D expenses to net sales
was unchanged at 3.1%.
Chiefly as a result of the increase in the ratio of SG&A to net
sales, operating income slid 2.7% to ¥43,898 million, and the
operating income margin declined 0.4 percentage point to 18.7%.
Looking at the operating income margin by quarter, the first quar-
ter showed 19.3%, the second 19.4%, the third 17.7%, and the
fourth 18.4%.