Pentax 2002 Annual Report Download - page 23
Download and view the complete annual report
Please find page 23 of the 2002 Pentax annual report below. You can navigate through the pages in the report by either clicking on the pages listed below, or by using the keyword search tool below to find specific information within the annual report.-
 1
1 -
2
-
3
-
4
-
5
-
6
-
7
-
8
-
9
-
10
-
11
-
12
-
 13
13 -
 14
14 -
 15
15 -
 16
16 -
 17
17 -
 18
18 -
 19
19 -
 20
20 -
 21
21 -
 22
22 -
 23
23 -
 24
24 -
 25
25 -
 26
26 -
 27
27 -
 28
28 -
 29
29 -
 30
30 -
 31
31 -
 32
32 -
 33
33 -
34
-
35
-
36
-
37
-
38
-
39
-
40
-
41
-
42
-
43
-
44
-
45
-
46
-
47
-
48
-
49
-
50
-
51
-
52
-
53
-
54
-
55
-
56
-
57
-
58
-
59
-
60
 |
 |
21
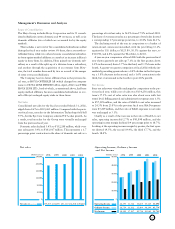
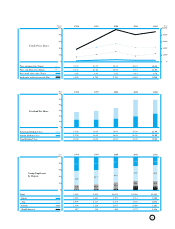
Net sales (Millions of yen)
Operating income ratio (%)
Ordinary income ratio (%)
Return on sales (%)
120,000
90,000
60,000
30,000
0
(Millions of yen)
(%)
Quarterly Net Sales
April 2000 to March 2002
2002
-4Q
2002
-3Q
2002
-2Q
2002
-1Q
2001
-4Q
2001
-3Q
2001
-2Q
2001
-1Q
* The worsening of return on sales for the fourth quarter of the fiscal year ended March 31, 2001, was due to the recording of an extraordinary loss that included ¥14,347 million of the
amortization of goodwill accompanying the integration of U.S. subsidiaries.
56,323
17.5
18.0
11.1
59,372
20.2
21.8
12.6
60,529
20.0
21.0
12.9
60,578
18.4
20.4
0.6
60,321
19.3
20.1
12.4
58,037
19.4
18.2
10.7
57,088
17.7
19.9
9.0
59,819
18.4
19.6
8.3*
30.0
15.0
0
16,000
12,000
8,000
4,000
0
(Millions of yen)
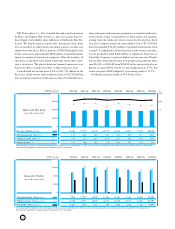
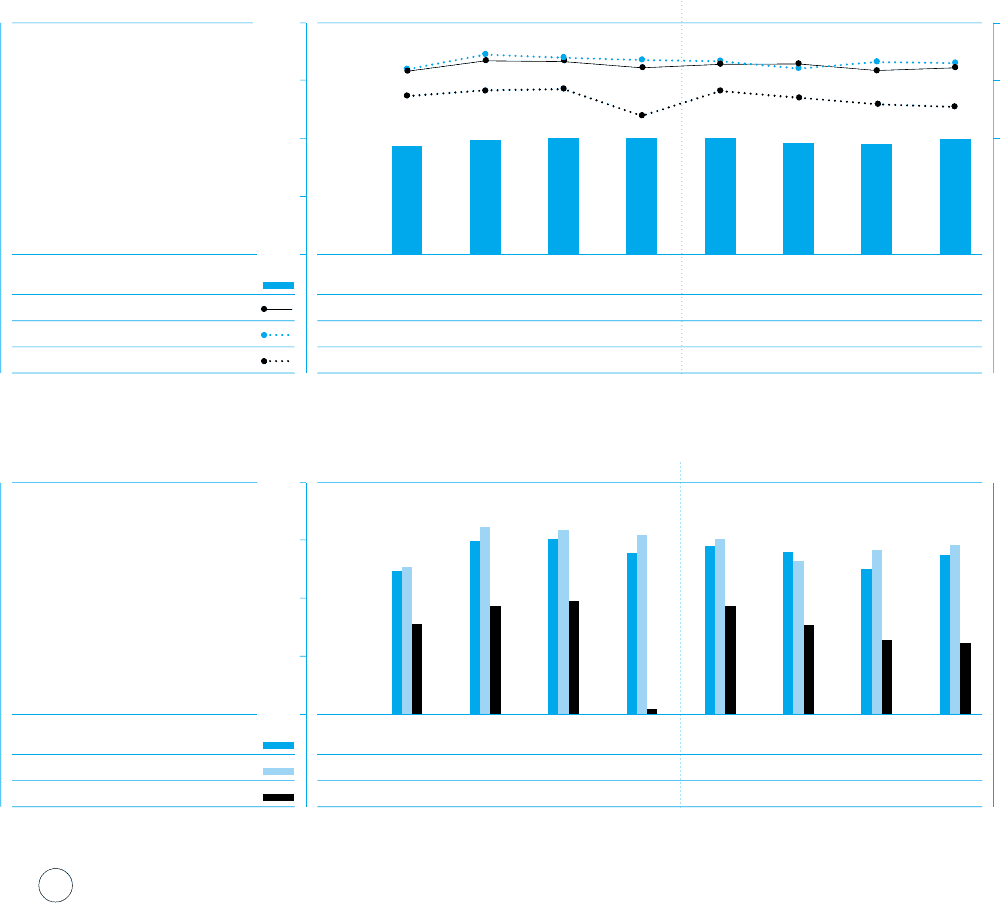
Operating income (Millions of yen)
Ordinary income (Millions of yen)
Net income (Millions of yen)
11,166
12,376
364
2002-4Q2002-3Q2002-2Q2002-1Q2001-4Q2001-3Q2001-2Q2001-1Q
* Net income of ¥364 million for the fourth quarter of the fiscal year ended March 31, 2001, was due to the recording of an extraordinary loss that included ¥14,347 million of the
amortization of goodwill accompanying the integration of U.S. subsidiaries.
Quarterly Profits
April 2000 to March 2002
9,885
10,146
6,233
11,987
12,967
7,458
12,090
12,695
7,805
11,166
12,376
364
11,613
12,124
7,468
11,234
10,573
6,192
10,068
11,368
5,142
10,983
11,709
4,939*
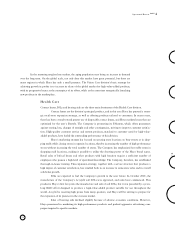
NH Technoglass Co., Ltd., founded through equal investment
by Hoya and Nippon Sheet Glass Co., Ltd., has a plant that pro-
duces liquid crystal display glass substrates in Yokkaichi, Mie Pre-
fecture. We deeply regret to report that, during this term, there
was an incident in which dust containing arsenic trioxide was
emitted from the plant. Hoya’s portion of NH Technoglass’s loss
in that connection, approximately ¥200 million, was posted against
equity in earnings of associated companies. After the incident, all
operations at the plant were halted while steps were taken to pre-
vent a recurrence. The plant’s divisions resumed operations once
they were able to confirm the safety of their respective areas.
Consolidated net income grew 8.6% to ¥23,741 million in the
fiscal year under review. Extraordinary losses of ¥8,700 million
were posted in connection with losses on sales of marketable secu-
rities, retirement and severance payments in connection with struc-
tural reforms, losses on liquidation of fixed assets, and expenses
arising from the temporary plant closure. In the previous fiscal
year, the Company posted an extraordinary loss of ¥17,087mil-
lion that included ¥14,347 million of goodwill amortization from
certain U.S. subsidiaries. In the fiscal year under review, amortiza-
tion of goodwill totaled ¥469 million, a significant drop that al-
lowed the Company to post its highest net income ever. Despite
the fact that extraordinary losses were posted, net income per share
rose ¥16.20, to ¥204.44 from ¥188.24 in the previous fiscal year.
Return on assets (ROA) rose by 0.1 percentage point to 8.7%, but
return on equity (ROE) slipped 0.3 percentage point to 11.5%.
Dividends remained steady at ¥50.00 per share.