Pentax 2002 Annual Report Download - page 50
Download and view the complete annual report
Please find page 50 of the 2002 Pentax annual report below. You can navigate through the pages in the report by either clicking on the pages listed below, or by using the keyword search tool below to find specific information within the annual report.-
 1
1 -
2
-
3
-
4
-
5
-
6
-
7
-
8
-
9
-
10
-
11
-
12
-
13
-
14
-
15
-
16
-
17
-
18
-
19
-
20
-
21
-
22
-
23
-
24
-
25
-
26
-
27
-
28
-
29
-
30
-
31
-
32
-
33
-
34
-
35
-
36
-
37
-
38
-
39
-
 40
40 -
 41
41 -
 42
42 -
 43
43 -
 44
44 -
 45
45 -
 46
46 -
 47
47 -
 48
48 -
 49
49 -
 50
50 -
 51
51 -
 52
52 -
 53
53 -
 54
54 -
 55
55 -
 56
56 -
 57
57 -
 58
58 -
 59
59 -
 60
60
 |
 |

48
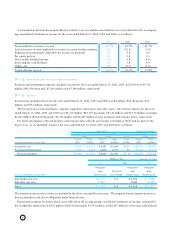
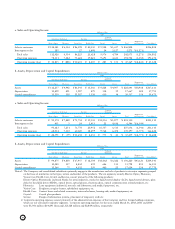
a. Sales and Operating Income
Thousands of U.S. Dollars
2002
Lifestyle
Information Technology Eye Care Refinement
Eliminations
Electro-Optics Photonics Vision Care Health Care Crystal Service Total and Corporate Consolidated
Sales to customers $ 763,128 $ 53,812 $700,632 $ 173,729 $ 66,075 $ 11,534 $1,768,910 $1,768,910
Intersegment sales 3,617 210 6,098 263 23,383 33,571 $(33,571)
Total sales 766,745 53,812 700,842 179,827 66,338 34,917 1,802,481 (33,571) 1,768,910
Operating expenses 557,805 57,323 592,474 154,045 66,346 33,022 1,461,015 (22,165) 1,438,850
Operating income (loss) $ 208,940 $ (3,511) $108,368 $ 25,782 $ (8) $ 1,895 $ 341,466 $(11,406) $ 330,060
b. Assets, Depreciation and Capital Expenditures
Thousands of U.S. Dollars
2002
Lifestyle
Information Technology Eye Care Refinement
Eliminations
Electro-Optics Photonics Vision Care Health Care Crystal Service Total and Corporate Consolidated
Assets $840,647 $ 33,947 $ 694,053 $ 118,917 $ 65,293 $ 25,902 $1,778,759 $311,978 $2,090,737
Depreciation 95,391 1,707 41,474 4,165 3,744 278 146,759 880 147,639
Capital expenditures 99,850 398 39,541 5,165 1,910 8 146,872 384 147,256
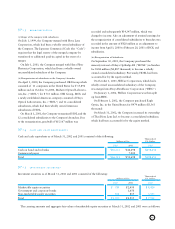
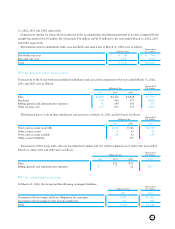
No»18 segment information
Information about industry segments, geographic segments and sales to foreign customers of the Company and consolidated
subsidiaries for the years ended March 31, 2002, 2001 and 2000 is as follows:
(1) Industry Segments
a. Sales and Operating Income
Millions of Yen
2002
Lifestyle
Information Technology Eye Care Refinement
Eliminations
Electro-Optics Photonics Vision Care Health Care Crystal Service Total and Corporate Consolidated
Sales to customers ¥101,496 ¥7,157 ¥93,184 ¥23,106 ¥8,788 ¥1,534 ¥235,265 ¥235,265
Intersegment sales 481 28 811 35 3,110 4,465 ¥(4,465)
Total sales 101,977 7,157 93,212 23,917 8,823 4,644 239,730 (4,465) 235,265
Operating expenses 74,188 7,624 78,799 20,488 8,824 4,392 194,315 (2,948) 191,367
Operating income (loss) ¥27,789 ¥(467) ¥14,413 ¥3,429 ¥(1) ¥252 ¥45,415 ¥(1,517) ¥43,898
b. Assets, Depreciation and Capital Expenditures
Millions of Yen
2002
Lifestyle
Information Technology Eye Care Refinement
Eliminations
Electro-Optics Photonics Vision Care Health Care Crystal Service Total and Corporate Consolidated
Assets ¥111,806 ¥4,515 ¥92,309 ¥15,816 ¥8,684 ¥3,445 ¥236,575 ¥41,493 ¥278,068
Depreciation 12,687 227 5,516 554 498 37 19,519 117 19,636
Capital expenditures 13,280 53 5,259 687 254 1 19,534 51 19,585