Pentax 2002 Annual Report Download - page 26
Download and view the complete annual report
Please find page 26 of the 2002 Pentax annual report below. You can navigate through the pages in the report by either clicking on the pages listed below, or by using the keyword search tool below to find specific information within the annual report.-
 1
1 -
2
-
3
-
4
-
5
-
6
-
7
-
8
-
9
-
10
-
11
-
12
-
13
-
14
-
15
-
 16
16 -
 17
17 -
 18
18 -
 19
19 -
 20
20 -
 21
21 -
 22
22 -
 23
23 -
 24
24 -
 25
25 -
 26
26 -
 27
27 -
 28
28 -
 29
29 -
 30
30 -
 31
31 -
 32
32 -
 33
33 -
 34
34 -
 35
35 -
 36
36 -
37
-
38
-
39
-
40
-
41
-
42
-
43
-
44
-
45
-
46
-
47
-
48
-
49
-
50
-
51
-
52
-
53
-
54
-
55
-
56
-
57
-
58
-
59
-
60
 |
 |

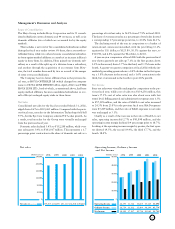
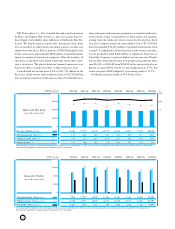
24
2000 2001 2002
120,000
80,000
60,000
40,000
20,000
0
(Millions of yen)
100,000
Net sales
Operating income
Return on sales (on total sales)
Assets
Depreciation
Capital expenditures
90,174
22,591
24.9%
112,341
34,815
30.8%
94,875
10,040
112,257
10,299
12,266 15,230
101,496
27,789
27.3%
111,806
12,687
13,280
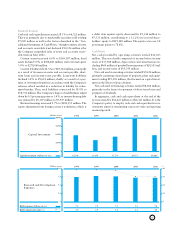
Depreciation
Return on sales (on total sales)
2000 2001 2002
(Millions of yen)
Net sales
Operating income
Assets
Capital expenditures
71,754
11,658
16.2%
86,198
10,601
12.3%
67,957
4,432
83,343
5,987
4,552 22,287
93,184
14,413
15.5%
92,309
5,516
5,259
60,000
40,000
20,000
0
80,000
100,000
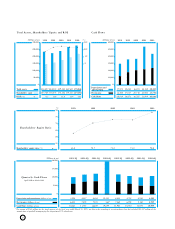
Depreciation
Return on sales (on total sales)
2000 2001 2002
(Millions of yen)
Net sales
Operating income
Assets
Capital expenditures
24,000
16,000
12,000
8,000
4,000
0
20,000
19,541
2,453
11.7%
20,130
2,405
11.1%
12,504
472
13,366
479
259 1,138
23,106
3,429
14.3%
15,816
554
687
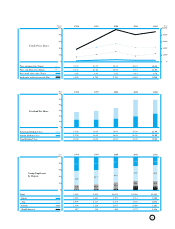
Depreciation
Return on sales (on total sales)
2000 2001 2002
(Millions of yen)
Net sales
Operating income (loss)
Assets
Capital expenditures
15,000
10,000
7,500
5,000
2,500
0
12,500
10,516
775
7.4%
9,942
285
2.9%
10,062
626
9,828
552
460 610
8,788
(1)
—
8,684
498
254
Information Technology (Electro-Optics Division) Eye Care (Vision Care Division)
Eye Care (Health Care Division) Lifestyle Refinement (Crystal Division)
Notes: 1. The return on sales above is the operating income margin calculated on net sales plus intersegment sales. Please refer to details on
page 48 Segment Information.
2. Data of Information Technology doesn’t include Photonics division.