Pentax 2002 Annual Report Download - page 37
Download and view the complete annual report
Please find page 37 of the 2002 Pentax annual report below. You can navigate through the pages in the report by either clicking on the pages listed below, or by using the keyword search tool below to find specific information within the annual report.-
 1
1 -
2
-
3
-
4
-
5
-
6
-
7
-
8
-
9
-
10
-
11
-
12
-
13
-
14
-
15
-
16
-
17
-
18
-
19
-
20
-
21
-
22
-
23
-
24
-
25
-
26
-
 27
27 -
 28
28 -
 29
29 -
 30
30 -
 31
31 -
 32
32 -
 33
33 -
 34
34 -
 35
35 -
 36
36 -
 37
37 -
 38
38 -
 39
39 -
 40
40 -
 41
41 -
 42
42 -
 43
43 -
 44
44 -
 45
45 -
 46
46 -
 47
47 -
48
-
49
-
50
-
51
-
52
-
53
-
54
-
55
-
56
-
57
-
58
-
59
-
60
 |
 |

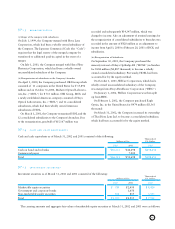
35
Thousands of
U.S. Dollars
Millions of Yen (Note 1)
2002 2001 2000 2002
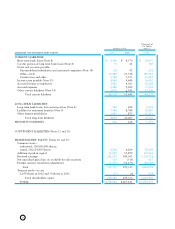
Operating Activities:
Income before income taxes and minority interests ¥37,588 ¥31,508 ¥33,492 $ 282,617
Adjustments for:
Income taxes—paid (15,395) (13,421) (13,771) (115,752)
Depreciation and amortization 19,636 17,791 17,234 147,639
Amortization of goodwill 469 14,347 3,526
Provision for (reversal of) allowance for doubtful receivables (1,530) 605 286 (11,504)
Provision for (reversal of) accrued bonuses to employees (191) 87 (62) (1,436)
Reversal of accrued retirement benefits (1,193) (798) (79) (8,970)
Provision for (reversal of) reserve for periodic repairs 243 (59) (261) 1,827
Losses on write-down of investment securities 479 1,214 398 3,602
Gain on sales of marketable and investment securities (137) (126) (430) (1,030)
Gain on sales of property, plant and equipment (336) (268) (251) (2,526)
Loss on sales of investment securities 3,118 364 23,444
Loss on disposal of property, plant and equipment 1,529 986 571 11,496
Foreign exchange gain (305) (753) (481) (2,293)
Bonuses to directors (195) (251) (293) (1,466)
Equity in earnings of associated companies (533) (1,865) (1,334) (4,008)
Other 632 363 4,752
Changes in assets and liabilities:
(Increase) decrease in notes and accounts receivable (915) (6,146) 541 (6,880)
(Increase) decrease in inventories 2,861 (1,749) (5,035) 21,511
(Increase) decrease in interest and dividend receivable 194 463 (121) 1,459
(Increase) decrease in other current assets 272 (510) 2,955 2,045
Increase (decrease) in notes and accounts payable (4,180) 1,544 1,158 (31,429)
Increase (decrease) in interest payable 1(32) 59 8
Increase (decrease) in other current liabilities (1,089) (556) 388 (8,188)
Total adjustments 3,435 11,230 1,472 25,827
Net cash provided by operating activities 41,023 42,738 34,964 308,444
Investing Activities:
Proceeds from sales of marketable securities 341
Proceeds from sales of investment securities 1,631 1,972 906 12,263
Purchases of investment securities (119) (2,706) (863) (895)
Payment for purchase of consolidated subsidiaries, net of cash acquired
(785) (16,409) (1,900) (5,902)
Proceeds from sales of property, plant and equipment 480 695 1,465 3,609
Purchases of property, plant and equipment (19,001) (21,589) (17,693) (142,864)
Decrease in other assets 557 1,246 697 4,188
Increase in other assets (2,417) (2,675) (2,849) (18,173)
Net cash used in investing activities (19,654) (39,466) (19,896) (147,774)
Financing Activities:
Net decrease in short-term borrowings (1,722) (83) (1,571) (12,947)
Proceeds from long-term bank loans 91 308 5 684
Repayments of long-term bank loans (126) (222) (540) (947)
Net proceeds from sales of (payments for purchases of)
treasury stock (17) 15 (9) (128)
Dividends paid (6,412) (4,582) (3,784) (48,211)
Net cash used in financing activities (8,186) (4,564) (5,899) (61,549)
Net Increase (Decrease) In Cash And Cash Equivalents 13,183 (1,292) 9,169 99,121
Cash And Cash Equivalents Increased By Merged Unconsolidated
Subsidiaries 290 2,180
Cash And Cash Equivalents Of Newly Consolidated Subsidiaries,
Beginning Of Year 36
Foreign Currency Translation Adjustments On Cash And Cash Equivalents
1,150 1,299 (1,021) 8,646
Cash And Cash Equivalents, Beginning Of Year 51,698 51,655 43,507 388,707
Cash And Cash Equivalents, End Of Year ¥66,321 ¥51,698 ¥51,655 $ 498,654
Hoya Corporation and Consolidated Subsidiaries
March 31, 2002, 2001 and 2000
Consolidated Statements of Cash Flows