Pentax 2002 Annual Report Download - page 20
Download and view the complete annual report
Please find page 20 of the 2002 Pentax annual report below. You can navigate through the pages in the report by either clicking on the pages listed below, or by using the keyword search tool below to find specific information within the annual report.-
 1
1 -
2
-
3
-
4
-
5
-
6
-
7
-
8
-
9
-
 10
10 -
 11
11 -
 12
12 -
 13
13 -
 14
14 -
 15
15 -
 16
16 -
 17
17 -
 18
18 -
 19
19 -
 20
20 -
 21
21 -
 22
22 -
 23
23 -
 24
24 -
 25
25 -
 26
26 -
 27
27 -
 28
28 -
 29
29 -
 30
30 -
31
-
32
-
33
-
34
-
35
-
36
-
37
-
38
-
39
-
40
-
41
-
42
-
43
-
44
-
45
-
46
-
47
-
48
-
49
-
50
-
51
-
52
-
53
-
54
-
55
-
56
-
57
-
58
-
59
-
60
 |
 |
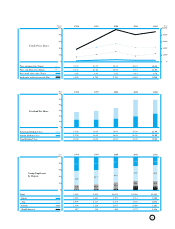
18
Ten-Year Summary
(Millions of yen) 1993 1994 1995 1996
Net sales ¥139,758 ¥134,473 ¥151,470 ¥167,106
Operating income 14,575 14,232 21,038 26,229
Ordinary income 13,875 12,878 21,001 27,376
Net income 5,296 6,119 8,812 11,056
Selling, general and administrative expenses/net sales (%)
29.6 28.9 29.9 29.6
Return on assets (%) 2.7 3.2 4.8 5.7
Return on equity (%) 4.8 5.5 7.6 9.0
Inventory turnover (Months) 4.0 4.0 3.5 3.2
Financial leverage (Times) 1.8 1.6 1.6 1.6
Capital investment 10,718 10,225 9,304 19,439
Depreciation and amortization 13,776 13,819 13,565 13,018
Research and development expenses (Billions of yen)
4.0 4.5 4.0 4.5
Per share data (Yen):
Net income 45.61 52.69 75.88 95.21
Cash flows 164.24 171.70 192.70 207.31
Shareholders’ equity 951.75 972.00 1,026.03 1,084.43
Price earnings ratio (Times) 36.18 33.59 31.63 38.65
Price cash flow ratio (Times) 10.05 10.31 12.45 17.75
Price book value ratio (Times) 1.73 1.82 2.34 3.39
Stock price at year-end (Yen) 1,650 1,770 2,400 3,680
FC
SD
inancial orporate
ection and ata