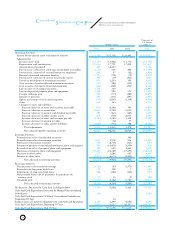
Pentax 2002 Annual Report Download - page 30
Download and view the complete annual report
Please find page 30 of the 2002 Pentax annual report below. You can navigate through the pages in the report by either clicking on the pages listed below, or by using the keyword search tool below to find specific information within the annual report.-
 1
1 -
2
-
3
-
4
-
5
-
6
-
7
-
8
-
9
-
10
-
11
-
12
-
13
-
14
-
15
-
16
-
17
-
18
-
19
-
 20
20 -
 21
21 -
 22
22 -
 23
23 -
 24
24 -
 25
25 -
 26
26 -
 27
27 -
 28
28 -
 29
29 -
 30
30 -
 31
31 -
 32
32 -
 33
33 -
 34
34 -
 35
35 -
 36
36 -
 37
37 -
 38
38 -
 39
39 -
 40
40 -
41
-
42
-
43
-
44
-
45
-
46
-
47
-
48
-
49
-
50
-
51
-
52
-
53
-
54
-
55
-
56
-
57
-
58
-
59
-
60
 |
 |
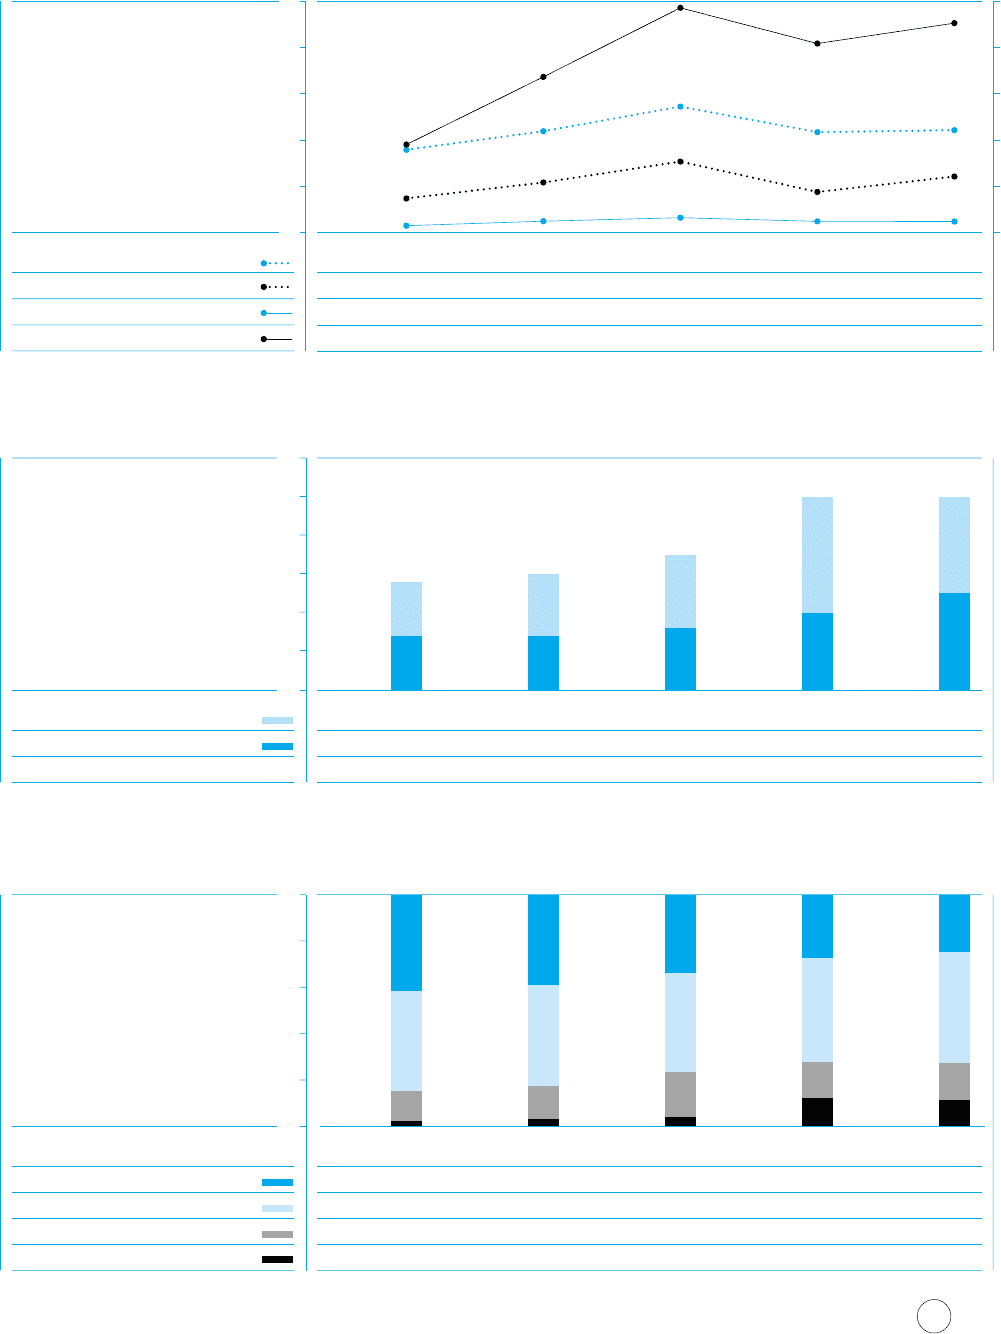
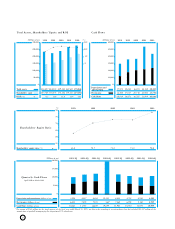
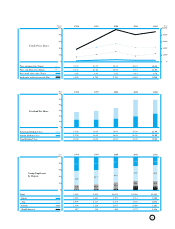
28
1998 1999 2000 2001 2002
100
80
40
20
0
(Times)
Stock Price Data
Price earnings ratio (Times)
Price cash flow ratio (Times)
Price book value ratio (Times)
Stock price at fiscal year-end (Yen)
60
10,000
8,000
4,000
2,000
0
(Yen)
6,000
35.74 43.75 54.38 43.35
14.75 21.63 30.64 17.55
2.99 4.92 6.43 4.85
3,800 6,720 9,700 8,160
44.22
23.94
4.79
9,040
1998 1999 2000 2001 2002
60
50
40
30
10
0
(Yen)
20
Dividend Per Share
Period-end dividend (Yen)
Interim dividend (Yen)
Total dividend (Yen)
14.00
14.00
28.00
14.00
16.00
30.00
16.00
19.00
35.00
20.00
30.00
50.00
25.00
25.00
50.00
Group Employees
by Region
19991998 2000 2001 2002
100
80
60
40
20
0
(%)
Japan
Total
Asia
Europe
North America
42.9
12.9
41.8
2.4
43.7
13.9
39.0
3.4
43.0
19.3
33.7
4.0
45.0
15.4
27.4
12.2
48.2
15.8
24.6
11.4
3,896
3,999
1,198
227
3,667
4,117
1,314
316
3,595
4,579
2,055
422
3,553
9,320 9,414 10,651 12,966
5,838
2,000
1,575
3,282
13,311
6,411
2,102
1,516