Pentax 2002 Annual Report Download - page 24
Download and view the complete annual report
Please find page 24 of the 2002 Pentax annual report below. You can navigate through the pages in the report by either clicking on the pages listed below, or by using the keyword search tool below to find specific information within the annual report.-
 1
1 -
2
-
3
-
4
-
5
-
6
-
7
-
8
-
9
-
10
-
11
-
12
-
13
-
 14
14 -
 15
15 -
 16
16 -
 17
17 -
 18
18 -
 19
19 -
 20
20 -
 21
21 -
 22
22 -
 23
23 -
 24
24 -
 25
25 -
 26
26 -
 27
27 -
 28
28 -
 29
29 -
 30
30 -
 31
31 -
 32
32 -
 33
33 -
 34
34 -
35
-
36
-
37
-
38
-
39
-
40
-
41
-
42
-
43
-
44
-
45
-
46
-
47
-
48
-
49
-
50
-
51
-
52
-
53
-
54
-
55
-
56
-
57
-
58
-
59
-
60
 |
 |
22
»Information Technology (Electro-Optics Division)
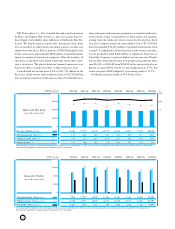
Net sales in the Electro-Optics division fell 9.7% to ¥101,496
million, dropping to 43.1% of total net sales from 47.4% in
the previous fiscal year. The division’s operating income sank
20.2% to ¥27,789 million. The ratio of operating income to
sales was 28.0% in the first quarter, 28.2% in the second quar-
ter, 26.4% in the third quarter, and 26.2% in the fourth. This
ratio worsened steadily following its peak in the second quar-
ter, and for the fiscal year as a whole was 27.3%, down from
30.8% in the previous fiscal year.
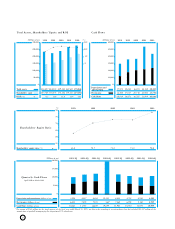
The net sales growth rate fell to a negative 9.7% from a
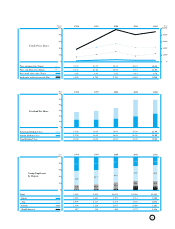
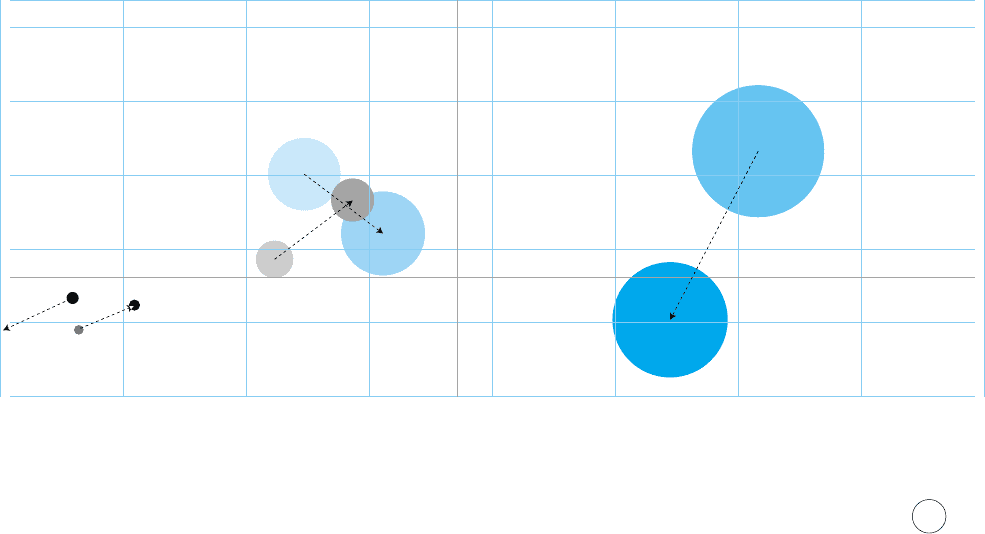
positive 24.6% in the previous fiscal year. The graph labeled
“Sales Growth and Profitability by Business Segment” on this
page shows that the share of this segment has shrunk mark-
edly, falling below the Company average of negative 0.6% on
the ordinate axis (which shows the net sales growth rate). Op-
erating income, as well, shows a significant decline, with the
circle representing its volume of the total shrinking by 20.2%.
Because the operating profit ratio declined by 3.5 percentage
points, this circle trended downward on the abscissa. How-
ever, this segment’s operating profit ratio is well above the Com-
pany average of 18.7%, and this sector can be said to have
been a pillar of the Company’s profits again this fiscal year.
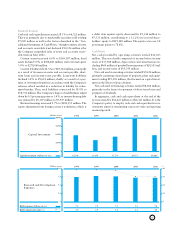
Capital expenditures in the division were reduced by 12.8%
to ¥13,280 million, as the Company narrowed its focus to the
development of next-generation products. This segment ac-
counted for 67.8% of the Group’s total capital investments.
»Eye Care (Vision Care Division)
The Vision Care division turned in solid performance, with
growth in both sales revenues and profits. In comparison to
the previous fiscal year, when results were boosted substan-
tially by the Company’s acquisition of U.S.-based Optical Re-
sources Group, Inc. (ORI), consolidated net sales rose 8.1% to
¥93,184 million in the fiscal year under review. This division’s
share of the Company’s consolidated net sales rose to 39.6%
from 36.4% in the previous fiscal year.
Operating income grew by 36.0% to ¥14,413 million. By
quarter, the operating income ratio was 15.4% in the first quar-
ter, 15.1% in the second, 13.3% in the third, and 17.9% in the
fourth. For the fiscal year, this segment’s operating income ra-
tio rose to 15.5% from 12.3% in the previous term.
The net sales growth rate declined to 8.1% from 20.1% a
year ago. On the graph below, the area of the circle represent-
ing this segment’s volume of operating income shrank slightly.
At the same time, though, because operating income rose sub-
stantially, that circle grew in size and moved toward the posi-
tive range on the abscissa, with the operating income ratio ris-
ing by 3.2 percentage points. This segment is now moving from
a stage in which growth is emphasized to one in which pri-
mary stress is on profitability. Even though growth in sales is
somewhat sluggish, it can be thought that stability should be
emphasized for the sake of overall business growth.
Capital expenditures in this division were unusually high in
fiscal 2001 as a result of the acquisition of ORI and, accord-
ingly, declined 76.4% to ¥5,259 million for the fiscal year un-
der review.
Review by Segment
0 5 10 15 20 25 30 35 40
-25
0
-10
5
35
20
50
Sales Growth and Profitability by Business Segment
Fiscal year ended March 31, 2002 (Compared with the previous fiscal year)
Vision Care
Company-wide ratio
Size of circle shows the volume of operating income.
Company-wide ratio
Health Care
Service
Crystal
Electro-Optics
Sales Growth Ratio (%)
Operating Income Ratio (%)