Pentax 2002 Annual Report Download - page 51
Download and view the complete annual report
Please find page 51 of the 2002 Pentax annual report below. You can navigate through the pages in the report by either clicking on the pages listed below, or by using the keyword search tool below to find specific information within the annual report.-
 1
1 -
2
-
3
-
4
-
5
-
6
-
7
-
8
-
9
-
10
-
11
-
12
-
13
-
14
-
15
-
16
-
17
-
18
-
19
-
20
-
21
-
22
-
23
-
24
-
25
-
26
-
27
-
28
-
29
-
30
-
31
-
32
-
33
-
34
-
35
-
36
-
37
-
38
-
39
-
40
-
 41
41 -
 42
42 -
 43
43 -
 44
44 -
 45
45 -
 46
46 -
 47
47 -
 48
48 -
 49
49 -
 50
50 -
 51
51 -
 52
52 -
 53
53 -
 54
54 -
 55
55 -
 56
56 -
 57
57 -
 58
58 -
 59
59 -
 60
60
 |
 |

49
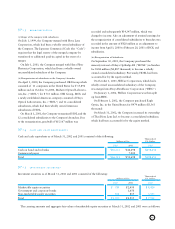
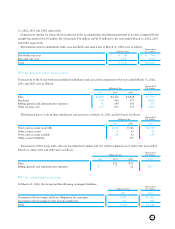
a. Sales and Operating Income
Millions of Yen
2001
Lifestyle
Information Technology Eye Care Refinement
Eliminations
Electro-Optics Photonics Vision Care Health Care Crystal Service Total and Corporate Consolidated
Sales to customers ¥112,341 ¥6,534 ¥86,198 ¥20,130 ¥9,942 ¥1,657 ¥236,802 ¥236,802
Intersegment sales 585 27 1,498 34 3,127 5,271 ¥(5,271)
Total sales 112,926 6,534 86,225 21,628 9,976 4,784 242,073 (5,271) 236,802
Operating expenses 78,111 7,422 75,624 19,223 9,691 4,633 194,704 (3,030) 191,674
Operating income (loss) ¥34,815 ¥(888) ¥10,601 ¥2,405 ¥285 ¥151 ¥47,369 ¥(2,241) ¥45,128
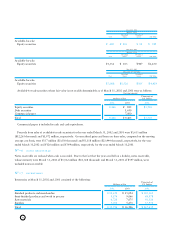
b. Assets, Depreciation and Capital Expenditures
Millions of Yen
2001
Lifestyle
Information Technology Eye Care Refinement
Eliminations
Electro-Optics Photonics Vision Care Health Care Crystal Service Total and Corporate Consolidated
Assets ¥112,257 ¥4,942 ¥83,343 ¥13,366 ¥9,828 ¥4,907 ¥228,643 ¥38,968 ¥267,611
Depreciation 10,299 291 5,987 479 552 59 17,667 124 17,791
Capital expenditures 15,230 218 22,287 1,138 610 34 39,517 156 39,673
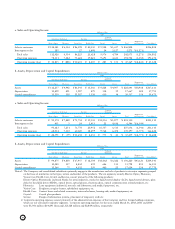
a. Sales and Operating Income
Millions of Yen
2000
Lifestyle
Information Technology Eye Care Refinement
Eliminations
Electro-Optics Photonics Vision Care Health Care Crystal Service Total and Corporate Consolidated
Sales to customers ¥90,174 ¥7,248 ¥71,754 ¥19,541 ¥10,516 ¥1,877 ¥201,110 ¥201,110
Intersegment sales 451 3 24 1,411 21 4,636 6,546 ¥(6,546)
Total sales 90,625 7,251 71,778 20,952 10,537 6,513 207,656 (6,546) 201,110
Operating expenses 68,034 7,310 60,120 18,499 9,762 6,472 170,197 (3,775) 166,422
Operating income (loss) ¥22,591 ¥(59) ¥11,658 ¥2,453 ¥775 ¥41 ¥37,459 ¥(2,771) ¥34,688
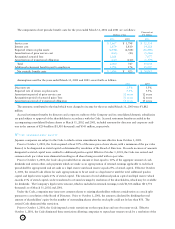
b. Assets, Depreciation and Capital Expenditures
Millions of Yen
2000
Lifestyle
Information Technology Eye Care Refinement
Eliminations
Electro-Optics Photonics Vision Care Health Care Crystal Service Total and Corporate Consolidated
Assets ¥94,875 ¥4,800 ¥67,957 ¥12,504 ¥10,062 ¥6,022 ¥196,220 ¥43,121 ¥239,341
Depreciation 10,040 117 4,432 472 626 111 15,798 253 16,051
Capital expenditures 12,266 75 4,552 259 460 22 17,634 136 17,770
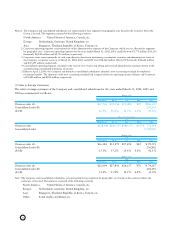
Notes:1. The Company and consolidated subsidiaries primarily engage in the manufacture and sale of products in six major segments grouped
on the basis of similarities in the types, nature and market of the products. The six segments, namely, Electro-Optics, Photonics,
Vision Care, Health Care, Crystal and Service, consist primarily of the following products:
Electro-Optics: Photomasks and mask blanks for semiconductors, masks for liquid-crystal display (LCD), liquid-crystal devices, glass
disks for hard disk drives (HDDs), optical lenses, optical glasses, electronic glass, optical communication related products, etc.
Photonics: Laser equipment (industrial, research and laboratory, and medical purposes), etc.
Vision Care: Eyeglasses, eyeglass frames, ophthalmic equipment, etc.
Health Care: Contact lenses and related accessories, intraocular lenses, hearing aids, medical equipment, etc.
Crystal: Crystal glass products
Service: Design of information systems, placement of temporary staff, etc.
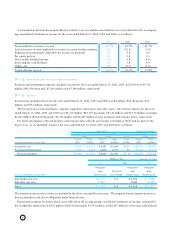
2. Corporate operating expenses consist primarily of the administration expenses of the Company and two foreign holding companies,
which are not allocated to industry segments. Corporate operating expenses for the years ended March 31, 2002, 2001 and 2000
were ¥1,981 million ($14,895 thousand), ¥2,328 million and ¥2,889 million, respectively.