Pentax 2002 Annual Report Download - page 28
Download and view the complete annual report
Please find page 28 of the 2002 Pentax annual report below. You can navigate through the pages in the report by either clicking on the pages listed below, or by using the keyword search tool below to find specific information within the annual report.-
 1
1 -
2
-
3
-
4
-
5
-
6
-
7
-
8
-
9
-
10
-
11
-
12
-
13
-
14
-
15
-
16
-
17
-
 18
18 -
 19
19 -
 20
20 -
 21
21 -
 22
22 -
 23
23 -
 24
24 -
 25
25 -
 26
26 -
 27
27 -
 28
28 -
 29
29 -
 30
30 -
 31
31 -
 32
32 -
 33
33 -
 34
34 -
 35
35 -
 36
36 -
 37
37 -
 38
38 -
39
-
40
-
41
-
42
-
43
-
44
-
45
-
46
-
47
-
48
-
49
-
50
-
51
-
52
-
53
-
54
-
55
-
56
-
57
-
58
-
59
-
60
 |
 |

26
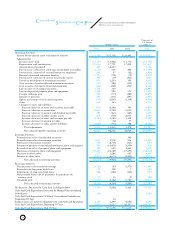
Financial Position
Cash and cash equivalents increased 28.3% to 66,321 million.
This was primarily due to marketable securities sold totaling
¥7,000 million as well as the factors described in the “Con-
solidated Statements of Cash Flows,” though transfers of notes
and accounts receivable trust declined ¥10,356 million after
the Company suspended sales of notes and accounts receiv-
able trusts in May 2001,
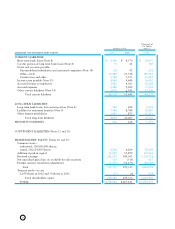
Current assets increased 9.6% to ¥169,587 million, fixed
assets declined 3.9% to ¥108,481 million, and total assets grew
3.9% to ¥278,068 million.
Current liabilities fell 20.3% to ¥49,114 million, principally
as a result of decreases in notes and accounts payable, short-
term loans and income taxes payable. Long-term liabilities
declined 3.8% to ¥9,618 million, chiefly as a result of a pay-
ment of retirement benefits in accordance with the Company’s
reforms, which resulted in a reduction in liability for retire-
ment benefits. Thus, total liabilities contracted by 18.0% to
¥58,732 million. The Company’s degree of indebtedness edged
down by 0.5 percentage point to 1.4%, as interest-bearing debt
was reduced by ¥1,107 million to ¥3,947 million.
Retained earnings increased 9.7% to ¥202,255 million. The
equity adjustment from foreign currency translation, which is
1998 1999 2000 2001 2002
40,000
30,000
20,000
10,000
0
(Millions of yen)
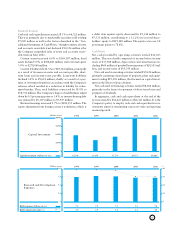
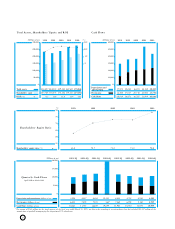
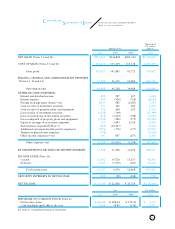
Capital Investment
Capital investment (Millions of yen) 19,504 13,654 17,770 39,673 19,585
10.0
7.5
5.0
2.5
0
(Millions of yen)
4.0
3.0
2.0
1.0
0
(%)
R&D expenses (Billions of yen)
R&D expenses/net sales (%)
1998 1999 2000 2001 2002
Research and Development
Expenses
7.5
3.9
7.8
3.9
7.7
3.8
7.3
3.1
7.3
3.1
a debit item against equity, decreased by ¥5,344 million to
¥5,331 million, contributing to a 12.2% rise in total share-
holders’ equity to ¥219,180 million. The equity ratio rose 5.8
percentage points to 78.8%.
Cash Flows
Net cash provided by operating activities totaled ¥41,023
million. This was chiefly composed of income before income
taxes of ¥37,588 million, depreciation and amortization (in-
cluding ¥469 million of goodwill amortization) of ¥20,105 mil-
lion, and income taxes of ¥15,395 million.
Net cash used in investing activities totaled ¥19,654 million,
primarily consisting of purchases of property, plant and equip-
ment totaling ¥19,001 million, that focused on capital invest-
ment in the Electro-Optics division.
Net cash used in financing activities totaled ¥8,186 million,
primarily in the form of repayment of short-term loans and
payment of dividends.
In aggregate, cash and cash equivalents at the end of the
year increased by ¥14,623 million to ¥66,321 million. It is the
Company’s policy to employ cash and cash equivalents in in-
vestments aimed at maximizing corporate value and spurring
renewed growth.