Nissan 2011 Annual Report Download - page 3
Download and view the complete annual report
Please find page 3 of the 2011 Nissan annual report below. You can navigate through the pages in the report by either clicking on the pages listed below, or by using the keyword search tool below to find specific information within the annual report.-
 1
1 -
 2
2 -
 3
3 -
 4
4 -
 5
5 -
 6
6 -
 7
7 -
 8
8 -
 9
9 -
 10
10 -
 11
11 -
 12
12 -
 13
13 -
 14
14 -
15
-
16
-
17
-
18
-
19
-
20
-
21
-
22
-
23
-
24
-
25
-
26
-
27
-
28
-
29
-
30
-
31
-
32
-
33
-
34
-
35
-
36
-
37
-
38
-
39
-
40
-
41
-
42
-
43
-
44
-
45
-
46
 |
 |

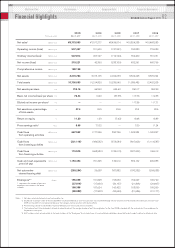
Notes: 1. Net sales are presented exclusive of consumption tax.
2. Diluted net income per share for the fiscal 2008 is not presented because a net loss per share was recorded although dilutive securities existed. Diluted net income per share for fiscal
2009 and fiscal 2010 is not presented because the Company had no securities with dilutive effects.
3. Price earnings ratio for fiscal 2008 is not presented because a net loss per share is recorded.
4. The number of part-time employees has been changed to present the average number of part-time employees for the fiscal 2008 compared with the year-end part-time employees for
the previous fiscal years.
5. Staff numbers, which are presented as the lower numbers in the “Employees” line, include those of unconsolidated subsidiaries accounted for by the equity method as reference data.
Millions of yen
Millions of yen
Millions of yen
Millions of yen
Millions of yen
Millions of yen
Millions of yen
Yen
Yen
Yen
%
%
Times
Millions of yen
Millions of yen
Millions of yen
Millions of yen
Millions of yen
Number
Net sales1
Operating income (loss)
Ordinary income (loss)
Net income (loss)
Comprehensive income
Net assets
Total assets
Net assets per share
Basic net income (loss) per share
Diluted net income per share2
Net assets as a percentage
of total assets
Return on equity
Price earnings ratio3
Cash flows
from operating activities
Cash flows
from investing activities
Cash flows
from financing activities
Cash and cash equivalents
at end of year
Net automotive
interest-bearing debt
Employees4, 5
( ) represents the number of part-time
employees not included in the above
numbers
¥10,468,583
776,939
761,051
460,796
—
3,876,994
12,402,208
862.29
112.33
111.71
28.6
13.89
11.24
1,042,827
(1,114,587
106,912
469,388
(254,638
165,729
(20,607
169,299
(21,177
)
)
)
)
2006
Mar. 31, 2007
¥10,824,238
790,830
766,400
482,261
—
3,849,443
11,939,482
860.17
117.76
117.56
29.4
13.68
7.00
1,342,284
(867,623
(307,002
584,102
(180,232
159,227
(21,308
163,099
(21,686
)
)
)
)
)
2007
Mar. 31, 2008
¥7,517,277
311,609
207,747
42,390
—
3,015,105
10,214,820
663.90
10.40
—
26.5
1.59
77.02
1,177,226
(496,532
(663,989
761,495
29,658
151,698
(17,600
157,624
(17,908
)
)
)
)
2009
Mar. 31, 2010
¥8,773,093
537,467
537,814
319,221
189,198
3,273,783
10,736,693
703.16
76.44
—
27.4
11.30
9.65
667,502
(331,118
110,575
1,153,453
(293,254
155,099
(27,816
159,398
(28,089
)
)
)
)
2010
Mar. 31, 2011
¥8,436,974
(137,921
(172,740
(233,709
—
2,926,053
10,239,540
644.60
(57.38
—
25.6
(7.62
—
890,726
(573,584
(135,013
746,912
387,882
155,659
(20,107
160,422
(20,649
)
)
)
)
)
)
)
)
)
2008
Mar. 31, 2009
For the years ended
Financial Highlights
Performance Corporate Data Corporate GovernanceMid-term Plan
02
NISSAN Annual Report 2011