Nissan 2011 Annual Report Download - page 26
Download and view the complete annual report
Please find page 26 of the 2011 Nissan annual report below. You can navigate through the pages in the report by either clicking on the pages listed below, or by using the keyword search tool below to find specific information within the annual report.-
 1
1 -
2
-
3
-
4
-
5
-
6
-
7
-
8
-
9
-
10
-
11
-
12
-
13
-
14
-
15
-
 16
16 -
 17
17 -
 18
18 -
 19
19 -
 20
20 -
 21
21 -
 22
22 -
 23
23 -
 24
24 -
 25
25 -
 26
26 -
 27
27 -
 28
28 -
 29
29 -
 30
30 -
 31
31 -
 32
32 -
 33
33 -
 34
34 -
 35
35 -
 36
36 -
37
-
38
-
39
-
40
-
41
-
42
-
43
-
44
-
45
-
46
 |
 |

998,822
738,950
2,746,836
158,012
641,055
139,529
201,649
283,789
519,148
(81,955
6,345,835
645,414
1,841,480
659,985
98,663
391,500
3,637,042
133,769
381,549
17,147
69,711
155,993
(4,353
620,047
4,390,858
10,736,693
802,410
641,154
2,645,853
50,641
540,407
127,190
134,681
229,093
500,434
(91,453
5,580,410
679,829
1,980,991
675,029
125,792
396,488
3,858,129
143,911
268,755
11,125
133,666
223,696
(4,872
632,370
4,634,410
10,214,820
)
)
)
)
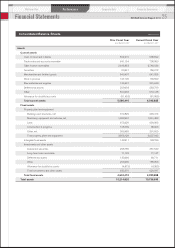
Assets
Current assets
Cash on hand and in banks
Trade notes and accounts receivable
Sales finance receivables
Securities
Merchandise and finished goods
Work in process
Raw materials and supplies
Deferred tax assets
Other
Allowance for doubtful accounts
Total current assets
Fixed assets
Property, plant and equipment
Buildings and structures, net
Machinery, equipment and vehicles, net
Land
Construction in progress
Other, net
Total property, plant and equipment
Intangible fixed assets
Investments and other assets
Investment securities
Long-term loans receivable
Deferred tax assets
Other
Allowance for doubtful accounts
Total investments and other assets
Total fixed assets
Total assets
Prior Fiscal Year
As of March 31, 2010
Current Fiscal Year
As of March 31, 2011
(Millions of yen)
Consolidated Balance Sheets
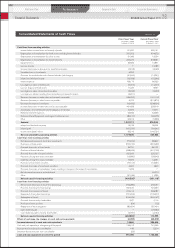
Financial Statements
Performance
Corporate Data Corporate GovernanceMid-term Plan
25
NISSAN Annual Report 2011