Nissan 2011 Annual Report Download - page 22
Download and view the complete annual report
Please find page 22 of the 2011 Nissan annual report below. You can navigate through the pages in the report by either clicking on the pages listed below, or by using the keyword search tool below to find specific information within the annual report.-
 1
1 -
2
-
3
-
4
-
5
-
6
-
7
-
8
-
9
-
10
-
11
-
 12
12 -
 13
13 -
 14
14 -
 15
15 -
 16
16 -
 17
17 -
 18
18 -
 19
19 -
 20
20 -
 21
21 -
 22
22 -
 23
23 -
 24
24 -
 25
25 -
 26
26 -
 27
27 -
 28
28 -
 29
29 -
 30
30 -
 31
31 -
 32
32 -
33
-
34
-
35
-
36
-
37
-
38
-
39
-
40
-
41
-
42
-
43
-
44
-
45
-
46
 |
 |
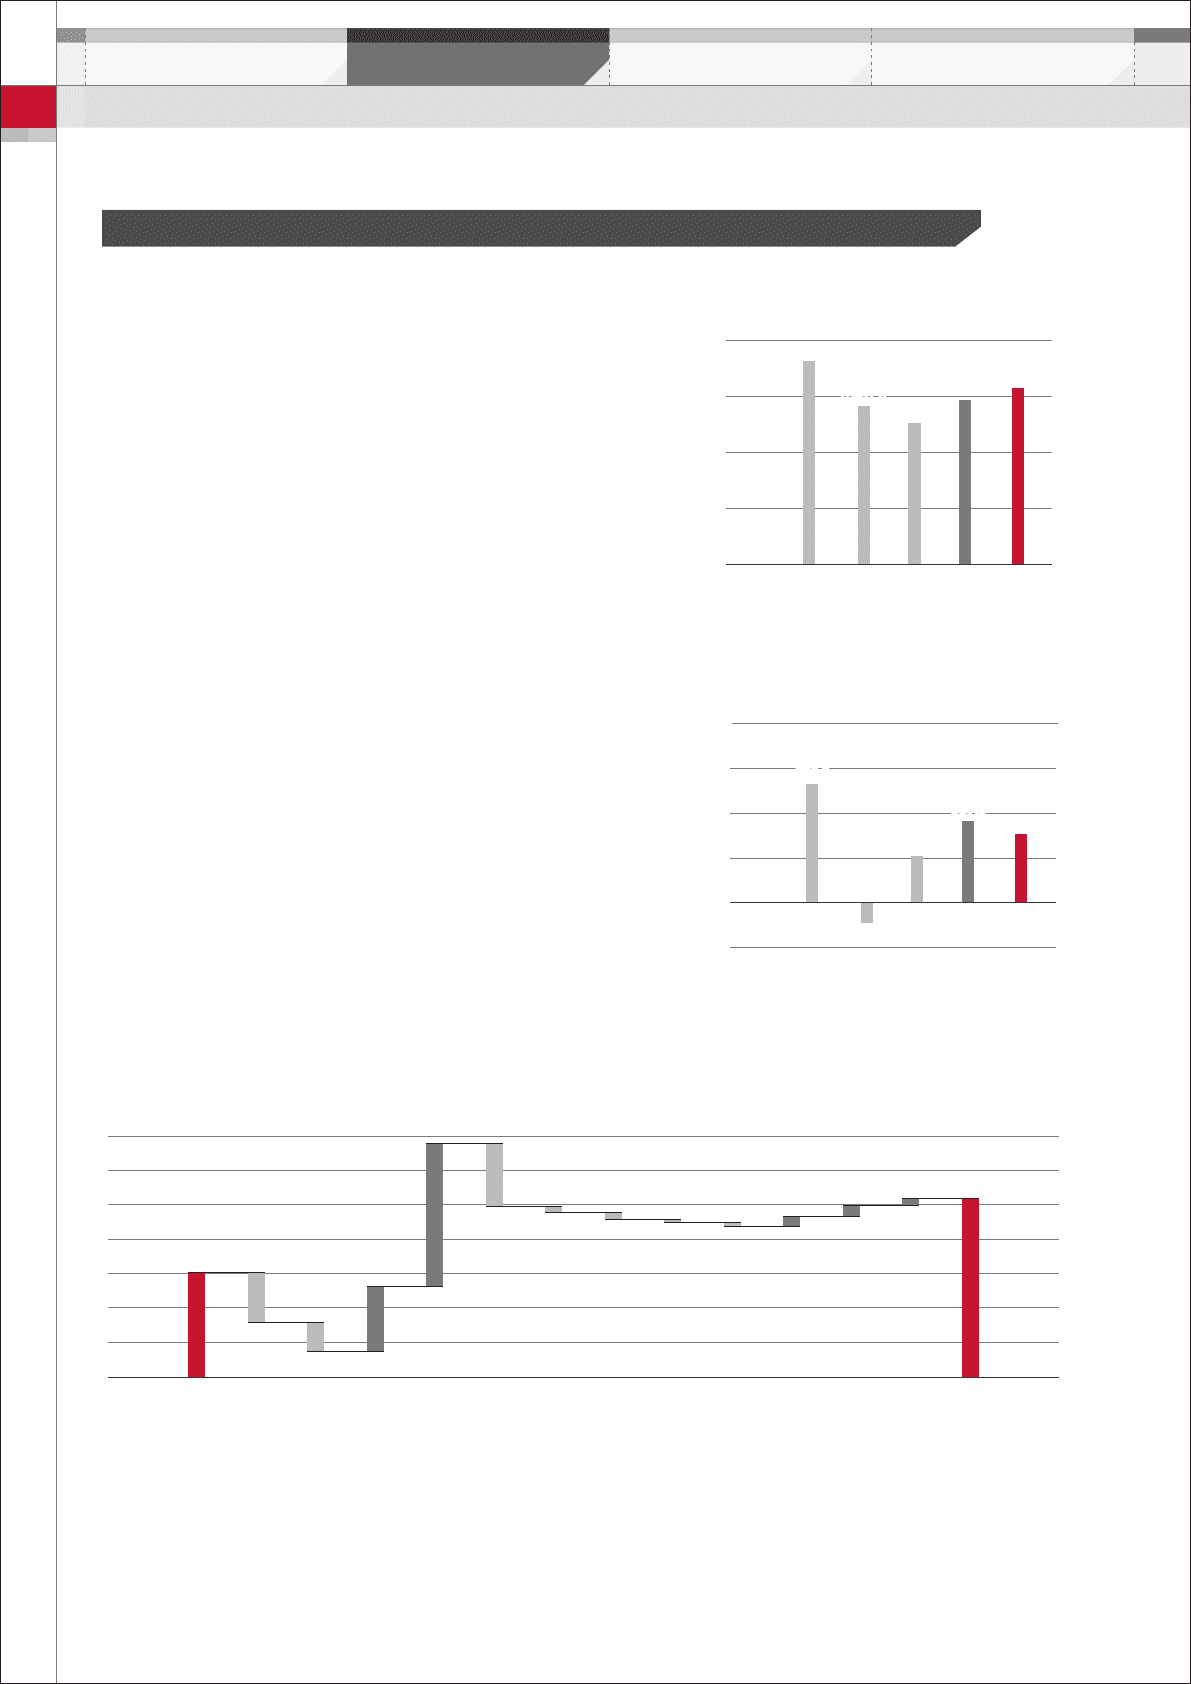
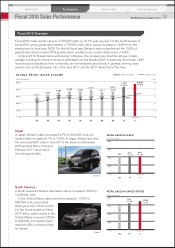
Fiscal 2010 Financial Performance
Net sales
For fiscal year 2010, consolidated net revenues increased 16.7%,
to ¥8.773 trillion, which reflected sales volume increase in spite of
the strong yen.
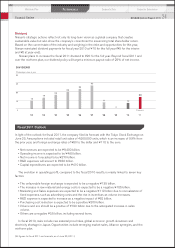
Operating profit
Consolidated operating profit totaled ¥537.5 billion, which was
improved 72.5% from last year. In comparison to last year’s
consolidated operating profit, the variance was due to the following
factors:
• Foreign exchange rate movements resulted in a ¥147.5 billion
negative impact. By currency, the majority of this variance was
due to the impact of the U.S. dollar at ¥117.3 billion, the
Russian ruble at ¥17.7 billion and the Canadian dollar at ¥1.8
billion.
• Net purchasing cost reduction efforts were a positive ¥105.8
billion. This included the negative impact from the increase in
raw material and energy cost by ¥85.2 billion.
• Volume and mix was a positive ¥433.1 billion due to the
increase in global sales volume.
• The increase in marketing and sales expenses was a negative
¥191.5 billion. This mainly came from the sales incentive
increase related to sales volume increase.
• R&D costs increased ¥18.5 billion.
• Sales financing contributed a positive ¥29.5 billion. This was
due mainly to improved borrowing costs across the globe and
lower credit loss ratio compared to fiscal year 2009.
• The remaining variance was a positive ¥15 billion, due mainly to
the increase in profit from affiliated companies.
NET SALES
12,000
9,000
6,000
3,000
0
(Billions of yen)
’10
8,773.1
’11
(Forecast)
9,400.0
’07
10,824.2
’08
8,437.08,437.0
’09
7,517.3
1,200
(Billions of yen)
900
600
0
300
−300
OPERATING PROFIT
’10
537.5537.5
(Forecast)
’11
460.0
’07
790.8790.8
’08
–137.9
’09
311.6
(Billions of yen)
FY09
O.P.
FY10
O.P.
IMPACT ON OPERATING PROFIT
Raw
material
/energy
cost
Mfg.
exp.
R&D
exp.
FOREX Selling
exp. Warranty
exp.
Purch.
cost
reduction
Resale of
returned
lease
vehicles
Volume/
mix AFLSales
finance After sales
&
others
311.6
311.6
537.5
-147.5
–147.5
–85.2
+191.0
–191.5
–19.8 –18.5
+433.1
–11.7 –7.1
+29.5 +32.2 +21.4
Financial Review
Performance
Corporate Data Corporate GovernanceMid-term Plan
21
NISSAN Annual Report 2011