Nissan 2011 Annual Report Download - page 28
Download and view the complete annual report
Please find page 28 of the 2011 Nissan annual report below. You can navigate through the pages in the report by either clicking on the pages listed below, or by using the keyword search tool below to find specific information within the annual report.-
 1
1 -
2
-
3
-
4
-
5
-
6
-
7
-
8
-
9
-
10
-
11
-
12
-
13
-
14
-
15
-
16
-
17
-
 18
18 -
 19
19 -
 20
20 -
 21
21 -
 22
22 -
 23
23 -
 24
24 -
 25
25 -
 26
26 -
 27
27 -
 28
28 -
 29
29 -
 30
30 -
 31
31 -
 32
32 -
 33
33 -
 34
34 -
 35
35 -
 36
36 -
 37
37 -
 38
38 -
39
-
40
-
41
-
42
-
43
-
44
-
45
-
46
 |
 |

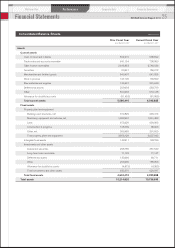
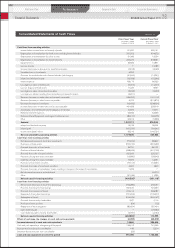
(Millions of yen)
Net sales
Cost of sales
Gross profit
Selling, general and administrative expenses
Advertising expenses
Service costs
Provision for warranty costs
Other selling expenses
Salaries and wages
Retirement benefit expenses
Supplies
Depreciation and amortization
Provision for doubtful accounts
Amortization of goodwill
Other
Total selling, general and administrative expenses
Operating income
Non-operating income
Interest income
Dividends income
Equity in earnings of affiliates
Derivative income
Miscellaneous income
Total non-operating income
Non-operating expenses
Interest expense
Equity in losses of affiliates
Amortization of net retirement benefit obligation at transition
Exchange loss
Derivative loss
Miscellaneous expenses
Total non-operating expenses
Ordinary income
Special gains
Gain on sales of fixed assets
Gain on sales of investment securities
Gain on dilution resulting from restructuring of domestic dealers
Other
Total special gains
Special losses
Loss on sale of fixed assets
Loss on disposal of fixed assets
Impairment loss
Write-down of investments and receivables
Loss on adjustment for changes of accounting standard for asset retirement obligations
Loss on disaster
Special addition to retirement benefits
Other
Total special losses
Income before income taxes and minority interests
Income taxes-current
Income taxes-deferred
Total income taxes
Income before minority interests
Income attributable to minority interests
Net income
8,773,093
7,155,100
1,617,993
187,490
52,865
93,842
118,304
333,824
21,906
6,369
56,860
21,425
5,786
181,855
1,080,526
537,467
14,551
1,045
43,022
14,102
13,883
86,603
28,357
—
10,671
28,854
�—
18,374
86,256
537,814
18,571
2,458
—
6,960
27,989
4,164
8,957
10,891
2,350
3,808
39,605
7,200
8,687
85,662
480,141
90,223
41,904
132,127
348,014
28,793
319,221
)
Current Fiscal Year
From April 1, 2010
To March 31, 2011
7,517,277
6,146,219
1,371,058
158,451
63,031
81,764
87,378
337,872
28,223
5,177
65,289
45,984
6,221
180,059
1,059,449
311,609
12,805
2,963
—
—
13,358
29,126
28,995
50,587
10,905
10,554
11,251
20,696
132,988
207,747
8,473
3,080
3,921
5,078
20,552
2,469
17,439
35,682
5,783
—
—
18,344
6,962
86,679
141,620
112,825
(21,285
91,540
—
7,690
42,390
Prior Fiscal Year
From April 1, 2009
To March 31, 2010
Consolidated Statements of Income
Financial Statements
Performance
Corporate Data Corporate GovernanceMid-term Plan
27
NISSAN Annual Report 2011