Nissan 2011 Annual Report Download - page 24
Download and view the complete annual report
Please find page 24 of the 2011 Nissan annual report below. You can navigate through the pages in the report by either clicking on the pages listed below, or by using the keyword search tool below to find specific information within the annual report.-
 1
1 -
2
-
3
-
4
-
5
-
6
-
7
-
8
-
9
-
10
-
11
-
12
-
13
-
 14
14 -
 15
15 -
 16
16 -
 17
17 -
 18
18 -
 19
19 -
 20
20 -
 21
21 -
 22
22 -
 23
23 -
 24
24 -
 25
25 -
 26
26 -
 27
27 -
 28
28 -
 29
29 -
 30
30 -
 31
31 -
 32
32 -
 33
33 -
 34
34 -
35
-
36
-
37
-
38
-
39
-
40
-
41
-
42
-
43
-
44
-
45
-
46
 |
 |
Sales finance
Due to the increase in retail sales, total financial assets of the sales finance segment increased by
1.3% to ¥4,414.3 billion from ¥4,355.9 billion in fiscal 2010. The sales finance segment generated
¥100.4 billion in operating profits in fiscal 2010, up from ¥77.5 billion in fiscal 2009. The improvement
in profitability was due to improved borrowing rates and lower credit loss ratio compared to the prior
year.
Investment policy
Capital expenditures totaled ¥312 billion, which was 3.6% of net revenue. Despite the economic crisis,
the company used capital expenditures in order to ensure Nissan’s future competitiveness. For fiscal
year 2010, the company invested committed to strategic initiatives, such as the zero-emission Nissan
LEAF electric vehicle and the V-platform Global Compact Car.
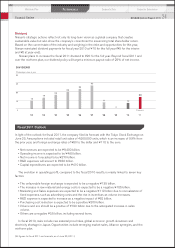
R&D expenditures totaled ¥399.3 billion. These funds were used to develop new technologies and
products. One of the company’s strengths is its extensive collaboration and development structure with
Renault’s R&D team, resulting from the Alliance.
Nissan plans more than 90 new advanced technologies, averaging 15 per year during our mid-term
plan, by 2016.
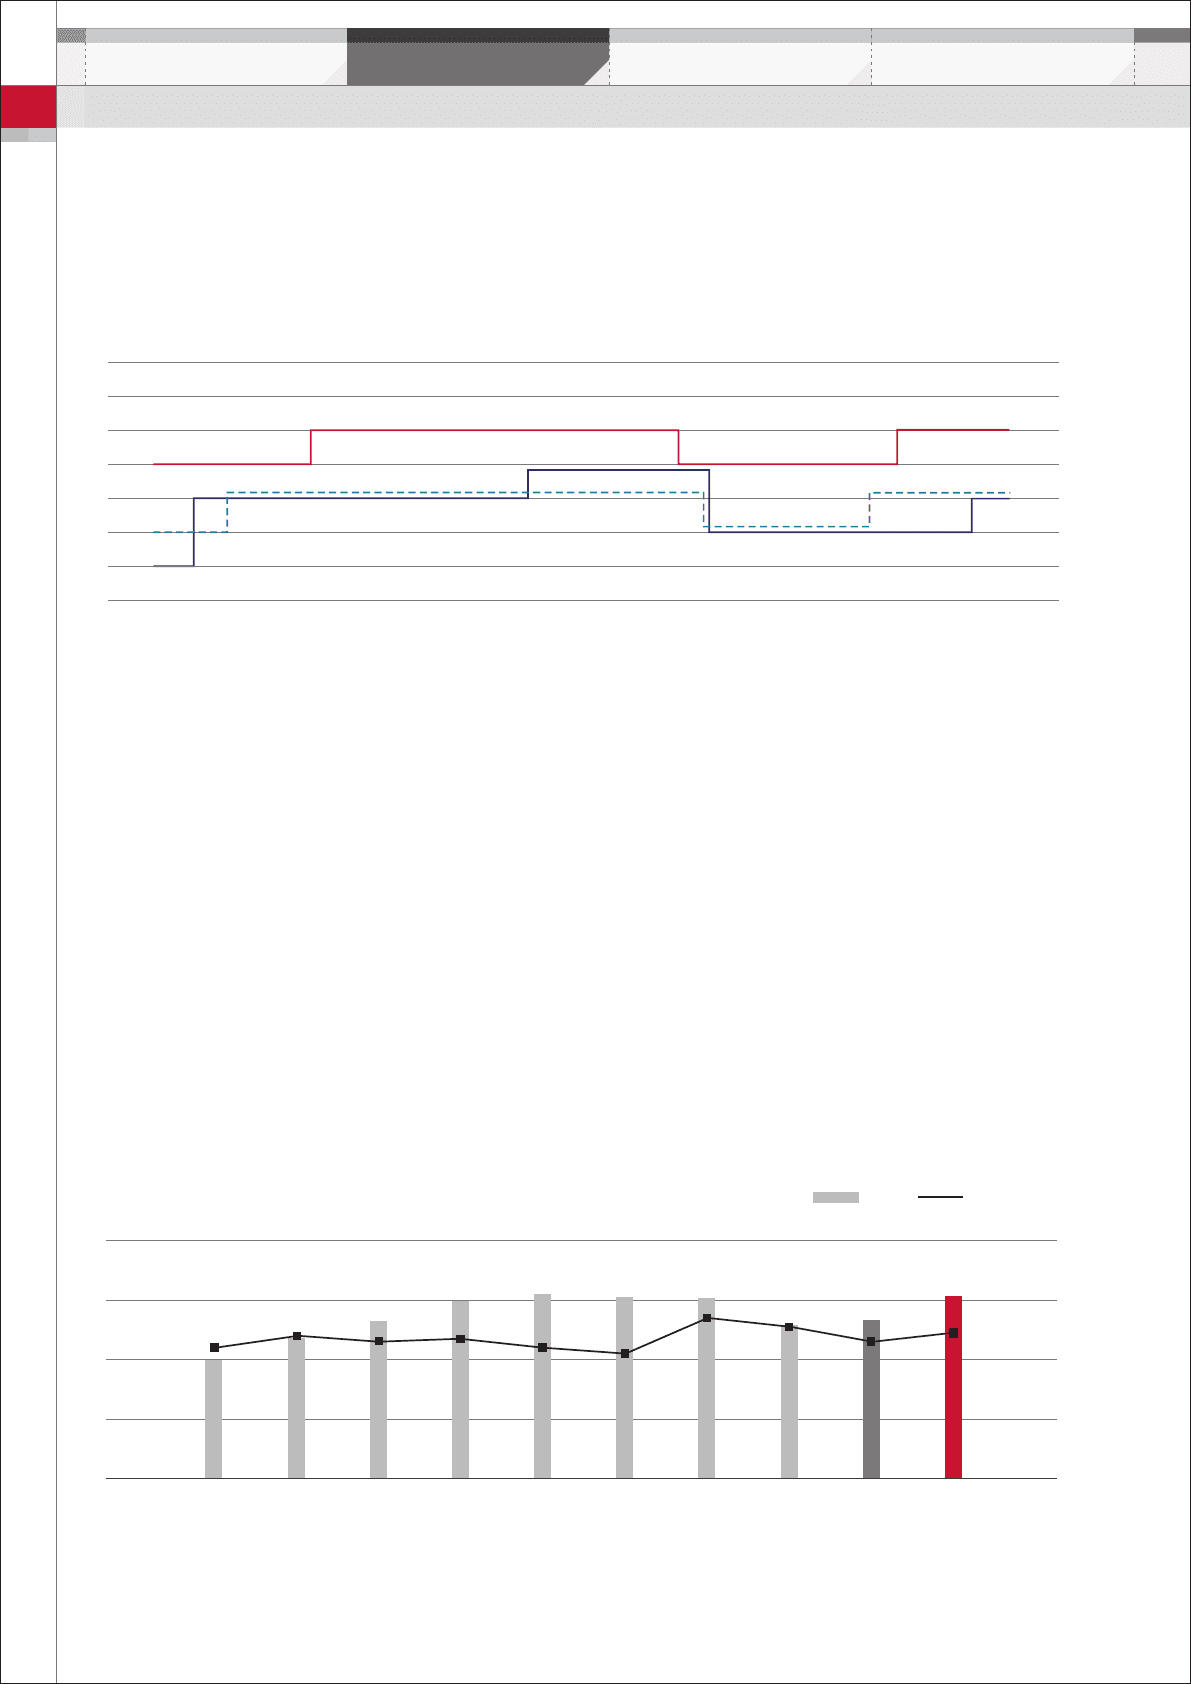
Aa3
A1
A2
A3
Baa1
Baa2
Baa3
Ba1
10/03 4/04 10/04 4/05 10/05 4/06 10/06 4/07 10/07 4/08 10/08 4/09 10/09 4/10 10/10 4/11 7/11
AA-
A+
A
A-
BBB+
BBB
BBB-
BB+
R&I
S&P
Moody’s
CORPORATE RATINGS
600
(Billions of yen)
450
300
150
0
8
6
4
2
0
(%)
’10
399.3
’11
(Forecast)
460
’09
386
’02
300
4.4%
’03
354
4.8%
’05
448
4.7%
’04
398
4.6% 4.6%
4.9%
5.1%
’08
456
5.4%
’07
458
4.2%
’06
465
4.4%
R&D EXPENDITURES % of net revenue
R&D
Credit rating
Nissan’s long-term credit rating with R&I is A with a stable outlook. S&P’s long-term credit rating for
Nissan is BBB+ with a stable outlook. Nissan’s rating with Moody’s is Baa1 with a positive outlook.
Financial Review
Performance
Corporate Data Corporate GovernanceMid-term Plan
23
NISSAN Annual Report 2011