Nissan 2011 Annual Report Download - page 23
Download and view the complete annual report
Please find page 23 of the 2011 Nissan annual report below. You can navigate through the pages in the report by either clicking on the pages listed below, or by using the keyword search tool below to find specific information within the annual report.-
 1
1 -
2
-
3
-
4
-
5
-
6
-
7
-
8
-
9
-
10
-
11
-
12
-
 13
13 -
 14
14 -
 15
15 -
 16
16 -
 17
17 -
 18
18 -
 19
19 -
 20
20 -
 21
21 -
 22
22 -
 23
23 -
 24
24 -
 25
25 -
 26
26 -
 27
27 -
 28
28 -
 29
29 -
 30
30 -
 31
31 -
 32
32 -
 33
33 -
34
-
35
-
36
-
37
-
38
-
39
-
40
-
41
-
42
-
43
-
44
-
45
-
46
 |
 |

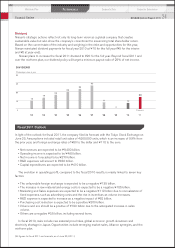
Net income
Net non-operating profit improved ¥104.2 billion from negative
¥103.9 billion to ¥0.3 billion in fiscal 2010. The positive impact
came from the equity in earnings of affiliates by ¥93.6 billion, from
negative ¥50.6 billion to positive ¥43.0 billion in fiscal 2010. As a
result, ordinary profit totaled ¥537.8 billion, which was improved by
¥330.1 billion from ¥207.7 billion in fiscal 2009.
Net extraordinary losses totaled ¥57.7 billion, an improvement of
¥8.4 billion from the previous year’s loss of ¥66.1 billion. This
improvement was due mainly to the positive impacts such as sales/
disposal of fixed assets (an increase of ¥16.8 billion), impairment
loss on fixed assets (a decrease of ¥24.8 billion) and special
addition to retirement benefits (a decrease of ¥11.1 billion), despite
the negative impact of ¥39.6 billion from the earthquake impact in
fiscal 2010.
Taxes totaled ¥132.1 billion, an increase of ¥40.6 billion from
fiscal 2009. Minority interests had a negative contribution of ¥28.8
billion in fiscal 2010.
Net income reached ¥319.2 billion, an increase of ¥276.8 billion
from fiscal 2009.
600
(Billions of yen)
450
300
150
0
−150
−300
’10’07 ’08 ’09
NET INCOME
319.2
(Forecast)
’11
270.0
482.3
–233.7
42.4
Financial Position
Balance sheet
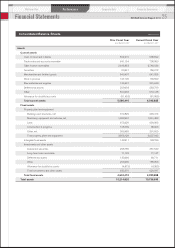
Current assets increased by 13.7% to ¥6,345.8 billion compared to March 31, 2010. This was mainly
due to increases in cash on hand and in banks by ¥196.4 billion, sales finance receivables by ¥101
billion, securities by ¥107.4 billion and merchandise and finished goods by ¥100.6 billion.
Fixed assets decreased by 5.3% to ¥4,390.9 billion compared to March 31, 2010. This was mainly
due to the decrease in machinery, equipment and vehicles, which was a net of ¥139.5 billion.
As a result, total assets increased by 5.1% to ¥10,736.7 billion compared to March 31, 2010.
Current liabilities increased by 13.6% to ¥4,380.5 billion compared to March 31, 2010. This was
mainly due to increases in trade notes and accounts payable by ¥180.2 billion, short-term borrowing by
¥243.7 billion and current portion of long-term borrowings by ¥238.3 billion, offsetting the decrease of
current portion of bonds by ¥319.9 billion. Long-term liabilities decreased by 7.8% to ¥3,082.4 billion
compared to March 31, 2010. This was mainly due to a decrease in long-term borrowing by ¥369.5
billion.
Net assets increased by 8.6% to ¥3,273.8 billion, compared to ¥3,015.1 billion as of March 31,
2010. This was mainly due to net income of ¥319.2 billion and a negative change in translation
adjustments by ¥173.1 billion.
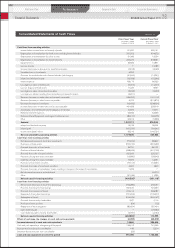
Free cash flow and net debt (auto business)
For fiscal year 2010, Nissan achieved a positive free cash flow of ¥459.3 billion. At the end of fiscal
year 2010, our net automotive debt improved significantly from last year to a net cash of ¥293.3. The
debt structure has also improved, since the company reduced its reliance on short-term borrowing.
We continue to maintain a close focus on our inventory of new vehicles. Inventory stood at 610,000
units at the end of fiscal 2010. The company continues to manage inventory carefully, in order to limit
its impact on free cash flow.
Financial Review
Performance
Corporate Data Corporate GovernanceMid-term Plan
22
NISSAN Annual Report 2011