National Grid 2016 Annual Report Download - page 98
Download and view the complete annual report
Please find page 98 of the 2016 National Grid annual report below. You can navigate through the pages in the report by either clicking on the pages listed below, or by using the keyword search tool below to find specific information within the annual report.-
 1
1 -
2
-
3
-
4
-
5
-
6
-
7
-
8
-
9
-
10
-
11
-
12
-
13
-
14
-
15
-
16
-
17
-
18
-
19
-
20
-
21
-
22
-
23
-
24
-
25
-
26
-
27
-
28
-
29
-
30
-
31
-
32
-
33
-
34
-
35
-
36
-
37
-
38
-
39
-
40
-
41
-
42
-
43
-
44
-
45
-
46
-
47
-
48
-
49
-
50
-
51
-
52
-
53
-
54
-
55
-
56
-
57
-
58
-
59
-
60
-
61
-
62
-
63
-
64
-
65
-
66
-
67
-
68
-
69
-
70
-
71
-
72
-
73
-
74
-
75
-
76
-
77
-
78
-
79
-
80
-
81
-
82
-
83
-
84
-
85
-
86
-
87
-
 88
88 -
 89
89 -
 90
90 -
 91
91 -
 92
92 -
 93
93 -
 94
94 -
 95
95 -
 96
96 -
 97
97 -
 98
98 -
 99
99 -
 100
100 -
 101
101 -
 102
102 -
 103
103 -
 104
104 -
 105
105 -
 106
106 -
 107
107 -
 108
108 -
109
-
110
-
111
-
112
-
113
-
114
-
115
-
116
-
117
-
118
-
119
-
120
-
121
-
122
-
123
-
124
-
125
-
126
-
127
-
128
-
129
-
130
-
131
-
132
-
133
-
134
-
135
-
136
-
137
-
138
-
139
-
140
-
141
-
142
-
143
-
144
-
145
-
146
-
147
-
148
-
149
-
150
-
151
-
152
-
153
-
154
-
155
-
156
-
157
-
158
-
159
-
160
-
161
-
162
-
163
-
164
-
165
-
166
-
167
-
168
-
169
-
170
-
171
-
172
-
173
-
174
-
175
-
176
-
177
-
178
-
179
-
180
-
181
-
182
-
183
-
184
-
185
-
186
-
187
-
188
-
189
-
190
-
191
-
192
-
193
-
194
-
195
-
196
-
197
-
198
-
199
-
200
-
201
-
202
-
203
-
204
-
205
-
206
-
207
-
208
-
209
-
210
-
211
-
212
 |
 |

Notes
2016
£m
2015
£m
2014
£m
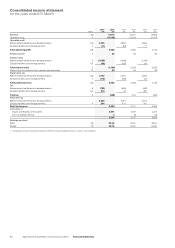
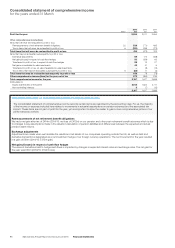
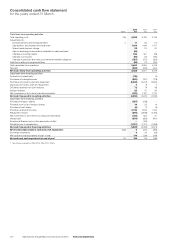
Profit for the year 2,594 2,011 2,464
Other comprehensive income/(loss)
Items that will never be reclassified to profit or loss:
Remeasurements of net retirement benefit obligations 22 539 (771) 485
Tax on items that will never be reclassified to profit or loss 6(125) 299 (172)
Total items that will never be reclassified to profit or loss 414 (472) 313
Items that may be reclassified subsequently to profit or loss:
Exchange adjustments 69 175 (158)
Net gains/(losses) in respect of cash flow hedges 50 (154) 63
Transferred to profit or loss in respect of cash flow hedges 29 13 27
Net gains on available-for-sale investments 43 41 6
Transferred to profit or loss on sale of available-for-sale investments –(8) (14)
Tax on items that may be reclassified subsequently to profit or loss 6(32) 11 (2)
Total items that may be reclassified subsequently to profit or loss 159 78 (78)
Other comprehensive income/(loss) for the year, net of tax 573 (394) 235
Total comprehensive income for the year 3,167 1,617 2,699
Attributable to:
Equity shareholders of the parent 3,164 1,624 2,711
Non-controlling interests 3(7) (12)
3,167 1,617 2,699
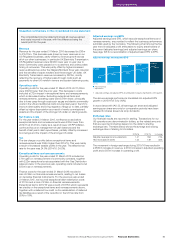
Unaudited commentary on consolidated statement of comprehensive income
The consolidated statement of comprehensive income records certain items as prescribed by the accounting rules. For us, the majority
ofthe income or expense included here relates to movements in actuarial assumptions on pension schemes and the associated tax
impact.These items are not part of profit for the year, yet are important to allow the reader to gain a more comprehensive picture of our
performance as a whole.
Remeasurements of net retirement benefit obligations
We had a net gain after tax of £414m (2014/15: net loss of £472m) on our pension and other post-retirement benefit schemes which is due
tochanges in key assumptions made in the valuation calculation of pension liabilities and differences between the expected and actual
pension asset returns.
Exchange adjustments
Adjustments are made when we translate the results and net assets of our companies operating outside the UK, as well as debt and
derivative transactions designated as a net investment hedge of our foreign currency operations. The net movement for the year resulted
ina gain of £69m (2014/15: £175m gain).
Net gains/(losses) in respect of cash flow hedges
The value of derivatives held to hedge cash flows is impacted by changes in expected interest rates and exchange rates. The net gain for
the year was £50m (2014/15: £154m loss).
96 National Grid Annual Report and Accounts 2015/16 Financial Statements
Consolidated statement of comprehensive income
for the years ended 31 March