National Grid 2016 Annual Report Download - page 126
Download and view the complete annual report
Please find page 126 of the 2016 National Grid annual report below. You can navigate through the pages in the report by either clicking on the pages listed below, or by using the keyword search tool below to find specific information within the annual report.-
 1
1 -
2
-
3
-
4
-
5
-
6
-
7
-
8
-
9
-
10
-
11
-
12
-
13
-
14
-
15
-
16
-
17
-
18
-
19
-
20
-
21
-
22
-
23
-
24
-
25
-
26
-
27
-
28
-
29
-
30
-
31
-
32
-
33
-
34
-
35
-
36
-
37
-
38
-
39
-
40
-
41
-
42
-
43
-
44
-
45
-
46
-
47
-
48
-
49
-
50
-
51
-
52
-
53
-
54
-
55
-
56
-
57
-
58
-
59
-
60
-
61
-
62
-
63
-
64
-
65
-
66
-
67
-
68
-
69
-
70
-
71
-
72
-
73
-
74
-
75
-
76
-
77
-
78
-
79
-
80
-
81
-
82
-
83
-
84
-
85
-
86
-
87
-
88
-
89
-
90
-
91
-
92
-
93
-
94
-
95
-
96
-
97
-
98
-
99
-
100
-
101
-
102
-
103
-
104
-
105
-
106
-
107
-
108
-
109
-
110
-
111
-
112
-
113
-
114
-
115
-
 116
116 -
 117
117 -
 118
118 -
 119
119 -
 120
120 -
 121
121 -
 122
122 -
 123
123 -
 124
124 -
 125
125 -
 126
126 -
 127
127 -
 128
128 -
 129
129 -
 130
130 -
 131
131 -
 132
132 -
 133
133 -
 134
134 -
 135
135 -
 136
136 -
137
-
138
-
139
-
140
-
141
-
142
-
143
-
144
-
145
-
146
-
147
-
148
-
149
-
150
-
151
-
152
-
153
-
154
-
155
-
156
-
157
-
158
-
159
-
160
-
161
-
162
-
163
-
164
-
165
-
166
-
167
-
168
-
169
-
170
-
171
-
172
-
173
-
174
-
175
-
176
-
177
-
178
-
179
-
180
-
181
-
182
-
183
-
184
-
185
-
186
-
187
-
188
-
189
-
190
-
191
-
192
-
193
-
194
-
195
-
196
-
197
-
198
-
199
-
200
-
201
-
202
-
203
-
204
-
205
-
206
-
207
-
208
-
209
-
210
-
211
-
212
 |
 |

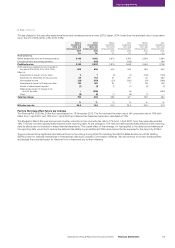
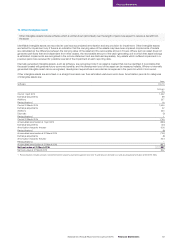
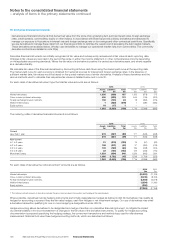
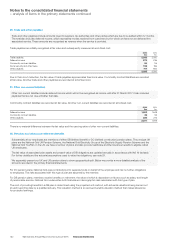
13. Financial and other investments
Financial and other investments include two main categories. Assets classified as available-for-sale typically represent investments in
short-term money funds and quoted investments in equities or bonds of other companies. The second category is loans and receivables
which includes bank deposits with a maturity of greater than three months, and cash balances that cannot be readily used in operations,
principally collateral pledged for certain borrowings.
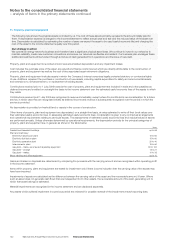
Financial assets, liabilities and equity instruments are classified according to the substance of the contractual arrangements entered into,
and recognised on trade date. Available-for-sale financial assets are non-derivatives that are either designated in this category or not classified
in any other categories.
Available-for-sale financial investments are recognised at fair value plus directly related incremental transaction costs, and are subsequently
carried at fair value in the statement of financial position. Changes in the fair value of available-for-sale investments are recognised directly
in other comprehensive income, until the investment is disposed of or is determined to be impaired. At this time the cumulative gain or loss
previously recognised in equity is included in the income statement for the period. Investment income is recognised using the effective interest
method and taken through interest income in the income statement.
Loans receivable and other receivables are initially recognised at fair value and subsequently held at amortised cost using the effective interest
method. Interest income, together with gains and losses when the loans and receivables are derecognised or impaired, are recognised in the
income statement.
Subsequent to initial recognition, the fair values of financial assets measured at fair value that are quoted in active markets are based on bid
prices. When independent prices are not available, fair values are determined by using valuation techniques that are consistent with techniques
commonly used by the relevant market. The techniques use observable market data.
2016
£m
2015
£m
Non-current
Available-for-sale investments 482 330
Current
Available-for-sale investments 1,951 1,232
Loans and receivables 1,047 1,327
2,998 2,559
3,480 2,889
Financial and other investments include the following:
Investments in short-term money funds11,516 618
Managed investments in equity and bonds2615 785
Cash surrender value of life insurance policies 160 158
Other investments –2
Restricted balances:
Collateral3999 1,19 9
Other 190 127
3,480 2,889
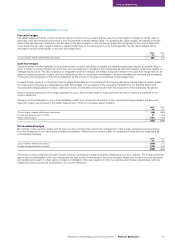
1. Includes £8m (2015: £34m) held by insurance captives and therefore restricted.
2. All £615m (2015: £644m) is restricted and relates to investments held by insurance captives of £434m (2015: £382m), US non-qualified plan investments of £181m (2015: £170m) and assets
held within security accounts with charges in favour of the UK pension scheme Trustees of £nil (2015: £92m).
3. Refers to collateral placed with counterparties with whom we have entered into a credit support annex to the ISDA (International Swaps and Derivatives Association) Master Agreement.
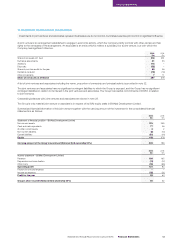
Available-for-sale investments are recorded at fair value. Due to their short maturities the carrying value of loans and receivables approximates
their fair value. The maximum exposure to credit risk at the reporting date is the fair value of the financial investments. For further information
on our credit risk, refer to note 30(a). None of the financial investments are past due or impaired.
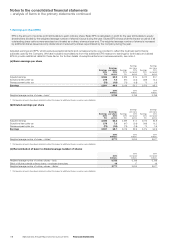
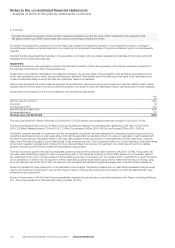
Notes to the consolidated financial statements
– analysis of items in the primary statements continued
124 National Grid Annual Report and Accounts 2015/16 Financial Statements