National Grid 2016 Annual Report Download - page 203
Download and view the complete annual report
Please find page 203 of the 2016 National Grid annual report below. You can navigate through the pages in the report by either clicking on the pages listed below, or by using the keyword search tool below to find specific information within the annual report.-
 1
1 -
2
-
3
-
4
-
5
-
6
-
7
-
8
-
9
-
10
-
11
-
12
-
13
-
14
-
15
-
16
-
17
-
18
-
19
-
20
-
21
-
22
-
23
-
24
-
25
-
26
-
27
-
28
-
29
-
30
-
31
-
32
-
33
-
34
-
35
-
36
-
37
-
38
-
39
-
40
-
41
-
42
-
43
-
44
-
45
-
46
-
47
-
48
-
49
-
50
-
51
-
52
-
53
-
54
-
55
-
56
-
57
-
58
-
59
-
60
-
61
-
62
-
63
-
64
-
65
-
66
-
67
-
68
-
69
-
70
-
71
-
72
-
73
-
74
-
75
-
76
-
77
-
78
-
79
-
80
-
81
-
82
-
83
-
84
-
85
-
86
-
87
-
88
-
89
-
90
-
91
-
92
-
93
-
94
-
95
-
96
-
97
-
98
-
99
-
100
-
101
-
102
-
103
-
104
-
105
-
106
-
107
-
108
-
109
-
110
-
111
-
112
-
113
-
114
-
115
-
116
-
117
-
118
-
119
-
120
-
121
-
122
-
123
-
124
-
125
-
126
-
127
-
128
-
129
-
130
-
131
-
132
-
133
-
134
-
135
-
136
-
137
-
138
-
139
-
140
-
141
-
142
-
143
-
144
-
145
-
146
-
147
-
148
-
149
-
150
-
151
-
152
-
153
-
154
-
155
-
156
-
157
-
158
-
159
-
160
-
161
-
162
-
163
-
164
-
165
-
166
-
167
-
168
-
169
-
170
-
171
-
172
-
173
-
174
-
175
-
176
-
177
-
178
-
179
-
180
-
181
-
182
-
183
-
184
-
185
-
186
-
187
-
188
-
189
-
190
-
191
-
192
-
 193
193 -
 194
194 -
 195
195 -
 196
196 -
 197
197 -
 198
198 -
 199
199 -
 200
200 -
 201
201 -
 202
202 -
 203
203 -
 204
204 -
 205
205 -
 206
206 -
 207
207 -
 208
208 -
 209
209 -
 210
210 -
 211
211 -
 212
212
 |
 |

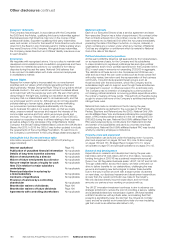
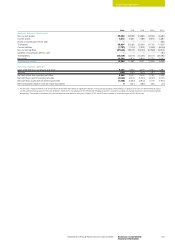
2016 2015 2014 2013120121
Summary statement of net assets
Non-current assets 52,622 49,058 44,895 45,129 41,684
Current assets 6,312 6,031 7,4 8 9 9,576 5,387
Assets of businesses held for sale –– – – 264
Total assets 58,934 55,089 52,384 54,705 47, 335
Current liabilities (7,721) ( 7, 374 ) ( 7, 3 31) ( 7,44 5 ) (6,004)
Non-current liabilities (37,648) (3 5,741) (3 3,13 4) (3 7,0 26 ) (32,001)
Liabilities of businesses held for sale –– – – (87)
Total liabilities (45,369) (43,115) (40,465) (44,471) (38,092)
Net assets 13,565 11,974 11,919 10,234 9,243
Shareholders’ equity 13,555 11,96 2 11,911 10,229 9,236
Summary cash flow statement
Cash generated from continuing operations 5,660 5,350 4,419 4,037 4,487
Tax paid (292) (343) (400) (287) (259)
Net cash inflow from operating activities 5,368 5,007 4,019 3,750 4,228
Net cash flows used in investing activities (4,036) (2,001) (1,330) (6,130) (2,371)
Net cash flows (used in)/from financing activities (1,328) (3,253) (2,972) 2,715 (1,900)
Net increase/(decrease) in cash and cash equivalents 4(247) (283) 335 (43)
1. For the years ended 31 March 2015 and 31 March 2016, there have been no significant changes in accounting standards, interpretations or policies that have a material financial impact
on the selected financial data. For the year ended 31 March 2014, the adoption of IAS 19 (revised) ‘Employee benefits’ resulted in a significant change in pensions and employee benefits
accounting. The numbers included in the selected financial data above for the years 31 March 2012 and 2013 were restated to show the impact of IAS 19 (revised).
Additional Information
201National Grid Annual Report and Accounts 2015/16 Summary consolidated
financial information