National Grid 2016 Annual Report Download - page 144
Download and view the complete annual report
Please find page 144 of the 2016 National Grid annual report below. You can navigate through the pages in the report by either clicking on the pages listed below, or by using the keyword search tool below to find specific information within the annual report.-
 1
1 -
2
-
3
-
4
-
5
-
6
-
7
-
8
-
9
-
10
-
11
-
12
-
13
-
14
-
15
-
16
-
17
-
18
-
19
-
20
-
21
-
22
-
23
-
24
-
25
-
26
-
27
-
28
-
29
-
30
-
31
-
32
-
33
-
34
-
35
-
36
-
37
-
38
-
39
-
40
-
41
-
42
-
43
-
44
-
45
-
46
-
47
-
48
-
49
-
50
-
51
-
52
-
53
-
54
-
55
-
56
-
57
-
58
-
59
-
60
-
61
-
62
-
63
-
64
-
65
-
66
-
67
-
68
-
69
-
70
-
71
-
72
-
73
-
74
-
75
-
76
-
77
-
78
-
79
-
80
-
81
-
82
-
83
-
84
-
85
-
86
-
87
-
88
-
89
-
90
-
91
-
92
-
93
-
94
-
95
-
96
-
97
-
98
-
99
-
100
-
101
-
102
-
103
-
104
-
105
-
106
-
107
-
108
-
109
-
110
-
111
-
112
-
113
-
114
-
115
-
116
-
117
-
118
-
119
-
120
-
121
-
122
-
123
-
124
-
125
-
126
-
127
-
128
-
129
-
130
-
131
-
132
-
133
-
 134
134 -
 135
135 -
 136
136 -
 137
137 -
 138
138 -
 139
139 -
 140
140 -
 141
141 -
 142
142 -
 143
143 -
 144
144 -
 145
145 -
 146
146 -
 147
147 -
 148
148 -
 149
149 -
 150
150 -
 151
151 -
 152
152 -
 153
153 -
 154
154 -
155
-
156
-
157
-
158
-
159
-
160
-
161
-
162
-
163
-
164
-
165
-
166
-
167
-
168
-
169
-
170
-
171
-
172
-
173
-
174
-
175
-
176
-
177
-
178
-
179
-
180
-
181
-
182
-
183
-
184
-
185
-
186
-
187
-
188
-
189
-
190
-
191
-
192
-
193
-
194
-
195
-
196
-
197
-
198
-
199
-
200
-
201
-
202
-
203
-
204
-
205
-
206
-
207
-
208
-
209
-
210
-
211
-
212
 |
 |

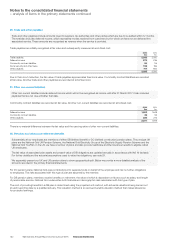
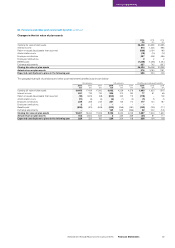
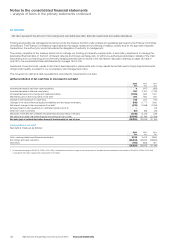
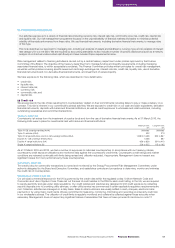
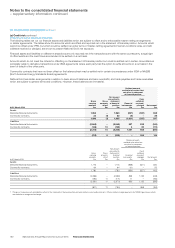
26. Net debt
Net debt represents the amount of borrowings and overdrafts less cash, financial investments and related derivatives.
Funding and liquidity risk management is carried out by the treasury function under policies and guidelines approved by the Finance Committee
of the Board. The Finance Committee is responsible for the regular review and monitoring of treasury activity and for the approval of specific
transactions, the authority for which fall outside the delegation of authority to management.
The primary objective of the treasury function is to manage our funding and liquidity requirements. A secondary objective is to manage the
associated financial risks, in the form of interest rate risk and foreign exchange risk, to within pre-authorised parameters. Details of the main
risks arising from our financing and commodity hedging activities can be found in the risk factors discussion starting on page 183 and in
note30 to the consolidated financial statements on pages 149 to 155.
Investment of surplus funds, usually in short-term fixed deposits or placements with money market funds that invest in highly liquid instruments
of high credit quality, is subject to our counterparty risk management policy.
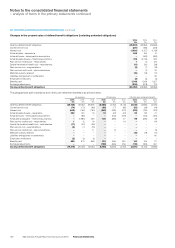
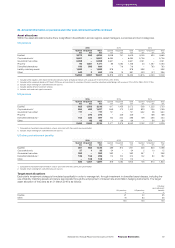
The movement in cash and cash equivalents is reconciled to movements in net debt.
(a) Reconciliation of net cash flow to movement in net debt
2016
£m
2015
£m
2014
£m
Increase/(decrease) in cash and cash equivalents 4(247) (283)
Increase/(decrease) in financial investments 391 (1,157 ) (1,720)
(Increase)/decrease in borrowings and related derivatives (1,10 0) 682 1,021
Net interest paid on the components of net debt1810 925 841
Change in debt resulting from cash flows 105 203 (141)
Changes in fair value of financial assets and liabilities and exchange movements (515) (1,777) 1,360
Net interest charge on the components of net debt1(913) (1,068) (1,053)
Extinguishment of debt resulting from LIPA MSA transition (note 4) ––98
Other non-cash movements (87) (83) (25)
Movement in net debt (net of related derivative financial instruments) in the year (1,410) (2,725) 239
Net debt (net of related derivative financial instruments) at start of year (23,915) (21,190 ) (21,429)
Net debt (net of related derivative financial instruments) at end of year (25,325) (23,915) (21,19 0)
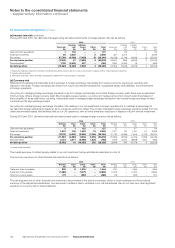
Composition of net debt
Net debt is made up as follows:
2016
£m
2015
£m
2014
£m
Cash, cash equivalents and financial investments 3,125 2,678 3,953
Borrowings and bank overdrafts (28,344) (25,910) (25,950)
Derivatives (106) (683) 807
(25,325) (23,915) (21,19 0)
1. An exceptional charge of £nil (2015: £131m; 2014: £nil) is included in net interest charge on the components of net debt and an exceptional cash outflow of £nil (2015: £152m; 2014: £nil)
isincluded in net interest paid on the components of net debt.
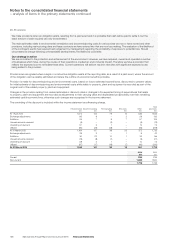
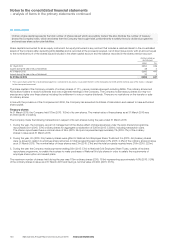
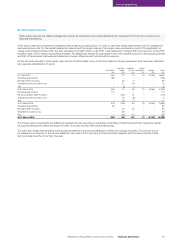
Notes to the consolidated financial statements
– analysis of items in the primary statements continued
142 National Grid Annual Report and Accounts 2015/16 Financial Statements