National Grid 2016 Annual Report Download - page 156
Download and view the complete annual report
Please find page 156 of the 2016 National Grid annual report below. You can navigate through the pages in the report by either clicking on the pages listed below, or by using the keyword search tool below to find specific information within the annual report.-
 1
1 -
2
-
3
-
4
-
5
-
6
-
7
-
8
-
9
-
10
-
11
-
12
-
13
-
14
-
15
-
16
-
17
-
18
-
19
-
20
-
21
-
22
-
23
-
24
-
25
-
26
-
27
-
28
-
29
-
30
-
31
-
32
-
33
-
34
-
35
-
36
-
37
-
38
-
39
-
40
-
41
-
42
-
43
-
44
-
45
-
46
-
47
-
48
-
49
-
50
-
51
-
52
-
53
-
54
-
55
-
56
-
57
-
58
-
59
-
60
-
61
-
62
-
63
-
64
-
65
-
66
-
67
-
68
-
69
-
70
-
71
-
72
-
73
-
74
-
75
-
76
-
77
-
78
-
79
-
80
-
81
-
82
-
83
-
84
-
85
-
86
-
87
-
88
-
89
-
90
-
91
-
92
-
93
-
94
-
95
-
96
-
97
-
98
-
99
-
100
-
101
-
102
-
103
-
104
-
105
-
106
-
107
-
108
-
109
-
110
-
111
-
112
-
113
-
114
-
115
-
116
-
117
-
118
-
119
-
120
-
121
-
122
-
123
-
124
-
125
-
126
-
127
-
128
-
129
-
130
-
131
-
132
-
133
-
134
-
135
-
136
-
137
-
138
-
139
-
140
-
141
-
142
-
143
-
144
-
145
-
 146
146 -
 147
147 -
 148
148 -
 149
149 -
 150
150 -
 151
151 -
 152
152 -
 153
153 -
 154
154 -
 155
155 -
 156
156 -
 157
157 -
 158
158 -
 159
159 -
 160
160 -
 161
161 -
 162
162 -
 163
163 -
 164
164 -
 165
165 -
 166
166 -
167
-
168
-
169
-
170
-
171
-
172
-
173
-
174
-
175
-
176
-
177
-
178
-
179
-
180
-
181
-
182
-
183
-
184
-
185
-
186
-
187
-
188
-
189
-
190
-
191
-
192
-
193
-
194
-
195
-
196
-
197
-
198
-
199
-
200
-
201
-
202
-
203
-
204
-
205
-
206
-
207
-
208
-
209
-
210
-
211
-
212
 |
 |

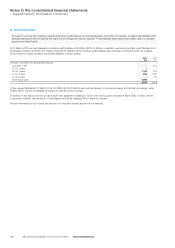
30. Financial risk management continued
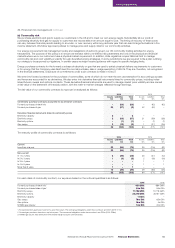
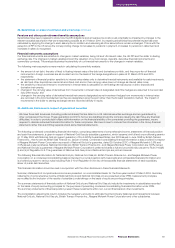
(f) Capital risk management
The capital structure of the Group consists of shareholders’ equity, as disclosed in the consolidated statement of changes in equity, and
netdebt (note 26). National Grid’s objectives when managing capital are: to safeguard our ability to continue as a going concern; to remain
within regulatory constraints of our regulated operating companies; and to maintain an efficient mix of debt and equity funding thus achieving
an optimal capital structure and cost of capital. We regularly review and manage the capital structure as appropriate in order to achieve
theseobjectives.
Maintaining appropriate credit ratings for our regulated companies is an important aspect of our capital risk management strategy and balance
sheet efficiency. As noted on page 25, we monitor our balance sheet efficiency using several metrics including our retained cash flow/net debt
and interest cover. Interest cover for the year ended 31 March 2016 was 5.5 (2015: 5.1). Our long-term target range for interest cover is greater
than 3.0, which we believe is consistent with single A range long-term senior unsecured debt credit ratings within our main UK operating
companies, NGET and NGG, based on guidance from the rating agencies.
In addition, we monitor the RAV gearing within each of NGET and the regulated transmission and distribution businesses within NGG. This is
calculated as net debt expressed as a percentage of RAV, and indicates the level of debt employed to fund our UK regulated businesses. It is
compared with the level of RAV gearing indicated by Ofgem as being appropriate for these businesses, at around 60 to 65%.
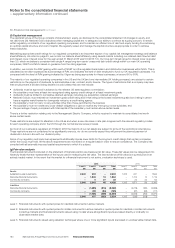
The majority of our regulated operating companies in the US and the UK (and one intermediate UK holding company), are subject to certain
restrictions on the payment of dividends by administrative order, contract and/or licence. The types of restrictions that a company may have
that would prevent a dividend being declared or paid unless they are met include:
• dividends must be approved in advance by the relevant US state regulatory commission;
• the subsidiary must have at least two recognised rating agency credit ratings of at least investment grade;
• dividends must be limited to cumulative retained earnings, including pre-acquisition retained earnings;
• National Grid plc must maintain an investment grade credit rating and if that rating is the lowest investment grade bond rating it cannot
havea negative watch/review for downgrade notice by a credit rating agency;
• the subsidiary must not carry on any activities other than those permitted by the licences;
• the subsidiary must not create any cross-default obligations or give or receive any intra-group cross-subsidies; and
• the percentage of equity compared with total capital of the subsidiary must remain above certain levels.
There is a further restriction relating only to the Narragansett Electric Company, which is required to maintain its consolidated net worth
abovecertain levels.
These restrictions are subject to alteration in the US as and when a new rate case or rate plan is agreed with the relevant regulatory bodies
foreach operating company and in the UK through the normal licence review process.
As most of our business is regulated, at 31 March 2016 the majority of our net assets are subject to some of the restrictions noted above.
These restrictions are not considered to be significantly onerous, nor do we currently expect they will prevent the planned payment of
dividendsin future in line with our dividend policy.
Some of our regulatory and bank loan agreements additionally impose lower limits for the long-term credit ratings that certain companies
withinthe Group must hold. All the above requirements are monitored on a regular basis in order to ensure compliance. The Company has
complied with all externally imposed capital requirements to which it is subject.
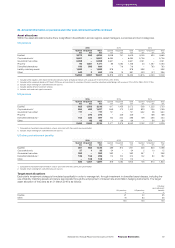
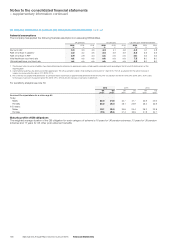
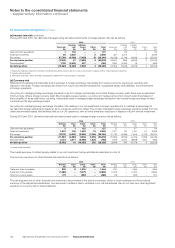
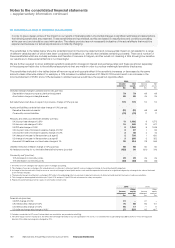
(g) Fair value analysis
The financial instruments included on the statement of financial position are measured at fair value. These fair values can be categorised into
hierarchy levels that are representative of the inputs used in measuring the fair value. The best evidence of fair value is a quoted price in an
actively traded market. In the event that the market for a financial instrument is not active, a valuation technique is used.
2016 2015
Level 1
£m
Level 2
£m
Level 3
£m
Total
£m
Level 1
£m
Level 2
£m
Level 3
£m
Total
£m
Assets
Available-for-sale investments 2,040 393 –2,433 1,315 247 –1,562
Derivative financial instruments –1,945 18 1,963 –1,702 14 1,716
Commodity contracts – 5 27 32 –22 42 64
2,040 2,343 45 4,428 1,315 1,971 56 3,342
Liabilities
Derivative financial instruments –(1,855) (214) (2,069) –(2,219) (180) (2,399)
Commodity contracts –(81) (54) (135) –(87) (84) (171)
–(1,936) (268) (2,204) –(2,306) (264) (2,570)
2,040 407 (223) 2,224 1,315 (335) (208) 772
Level 1: Financial instruments with quoted prices for identical instruments in active markets.
Level 2: Financial instruments with quoted prices for similar instruments in active markets or quoted prices for identical or similar instruments
ininactive markets and financial instruments valued using models where all significant inputs are based directly or indirectly on
observable market data.
Level 3: Financial instruments valued using valuation techniques where one or more significant inputs are based on unobservable market data.
154 National Grid Annual Report and Accounts 2015/16 Financial Statements
Notes to the consolidated financial statements
– supplementary information continued