National Grid 2016 Annual Report Download - page 109
Download and view the complete annual report
Please find page 109 of the 2016 National Grid annual report below. You can navigate through the pages in the report by either clicking on the pages listed below, or by using the keyword search tool below to find specific information within the annual report.-
 1
1 -
2
-
3
-
4
-
5
-
6
-
7
-
8
-
9
-
10
-
11
-
12
-
13
-
14
-
15
-
16
-
17
-
18
-
19
-
20
-
21
-
22
-
23
-
24
-
25
-
26
-
27
-
28
-
29
-
30
-
31
-
32
-
33
-
34
-
35
-
36
-
37
-
38
-
39
-
40
-
41
-
42
-
43
-
44
-
45
-
46
-
47
-
48
-
49
-
50
-
51
-
52
-
53
-
54
-
55
-
56
-
57
-
58
-
59
-
60
-
61
-
62
-
63
-
64
-
65
-
66
-
67
-
68
-
69
-
70
-
71
-
72
-
73
-
74
-
75
-
76
-
77
-
78
-
79
-
80
-
81
-
82
-
83
-
84
-
85
-
86
-
87
-
88
-
89
-
90
-
91
-
92
-
93
-
94
-
95
-
96
-
97
-
98
-
 99
99 -
 100
100 -
 101
101 -
 102
102 -
 103
103 -
 104
104 -
 105
105 -
 106
106 -
 107
107 -
 108
108 -
 109
109 -
 110
110 -
 111
111 -
 112
112 -
 113
113 -
 114
114 -
 115
115 -
 116
116 -
 117
117 -
 118
118 -
 119
119 -
120
-
121
-
122
-
123
-
124
-
125
-
126
-
127
-
128
-
129
-
130
-
131
-
132
-
133
-
134
-
135
-
136
-
137
-
138
-
139
-
140
-
141
-
142
-
143
-
144
-
145
-
146
-
147
-
148
-
149
-
150
-
151
-
152
-
153
-
154
-
155
-
156
-
157
-
158
-
159
-
160
-
161
-
162
-
163
-
164
-
165
-
166
-
167
-
168
-
169
-
170
-
171
-
172
-
173
-
174
-
175
-
176
-
177
-
178
-
179
-
180
-
181
-
182
-
183
-
184
-
185
-
186
-
187
-
188
-
189
-
190
-
191
-
192
-
193
-
194
-
195
-
196
-
197
-
198
-
199
-
200
-
201
-
202
-
203
-
204
-
205
-
206
-
207
-
208
-
209
-
210
-
211
-
212
 |
 |

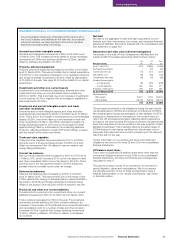
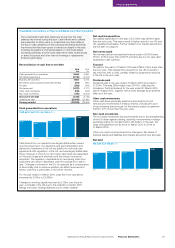
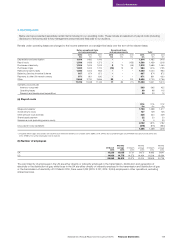
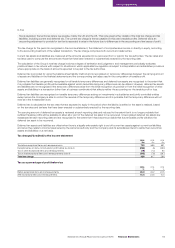
Unaudited commentary on the results of our principal operations by segment
As a business, we have three measures of operating profit that
are used on a regular basis and disclosed in this Annual Report.
Statutory operating profit: This is operating profit as calculated
under International Financial Reporting Standards (IFRS). Statutory
operating profit by segment is shown in note 2 on page 106.
Adjusted operating profit: Adjusted operating profit (business
performance) excludes items that if included could distort
understanding of our performance for the year and the comparability
between periods. Further details of items that are excluded in
adjusted operating profit are shown in note 4 on page 111.
Regulated financial performance: This is particularly relevant for
our UK operations and is a measure of operating profit that reflects
the impact of the businesses’ regulatory arrangements when
presenting financial performance.
Reconciliations between statutory and adjusted operating profit
canbe found on page 196. Reconciliations between adjusted
operating profit and regulated financial performance for UK
ElectricityTransmission, UK Gas Transmission and UK Gas
Distribution can be found on page 108.
Commentary on segmental adjusted operating profit results
We have summarised the results of our principal operating
segments here by segment to provide direct reference to the
results as disclosed in note 2. This analysis has been prepared
based on adjusted operating profit (operating profit before
exceptional items and remeasurements) as set out in note 2(b).
UK Electricity Transmission
For the year ended 31 March 2016, revenue in the UK Electricity
Transmission segment increased by £223m to £3,977m, and
adjusted operating profit decreased by £64m to £1,173m.
The revenue growth of £223m was principally due to the recovery
of higher pass-through costs such as payments to other UK
network owners and system balancing costs, and under-recoveries
of allowed revenues in the prior year. This was partly offset by
reductions inallowed revenues this year and a legal settlement
received in 2014/15 that did not repeat this year. Net revenue
(after deducting pass-through costs) was £14m higher. Regulated
controllable costs were £28m higher due to inflation and salary
growth, together with legal cost recoveries in the prior year, higher
tower maintenance costs and transformation costs associated with
our System Operator business. Depreciation and amortisation was
£14m higher reflecting the continued capital investment programme.
Other costs were £36m higher than prior year due to additional
asset impairments this year and lower scrap and disposal proceeds.
Capital investment remained around the same level as last year
at£1,084m.
UK Gas Transmission
Revenue in the UK Gas Transmission segment increased by £25m
in 2015/16 to £1,047m and adjusted operating profit increased by
£49m to £486m.
Revenue was £25m higher, principally due to over-recoveries
ofallowed revenues in the year. Regulated controllable costs were
£10m higher than last year, mainly as a result of inflation, higher
gassystem service charges and organisational change costs.
Depreciation costs were £6m higher due to ongoing investment
(investment in the year was £186m, similar to last year). Other
operating costs were £19m lower than last year, mostly reflecting
additional costs in 2014/15 relating to the closure of LNG facilities.
UK Gas Distribution
UK Gas Distribution revenue increased by £51m in the year
to£1,918m, and adjusted operating profit increased by £52m
to£878m.
Revenue was £51m higher, principally reflecting increased regulatory
allowances. In part, these allowances were increased to compensate
for expected increases in taxation costs reflecting a change to the
tax treatment of replacement expenditure. Regulated controllable
costs were £21m higher due to inflation, recruitment, property costs
and higher charges from our strategic partners to coverconnections
and winter resourcing. Depreciation and amortisation was £12m
higher reflecting the continued mains replacement programme
(investment in the year was £51m higher at £549m). Pass-through
costs charged to customers were £11m lower this year, and other
costs were £23m lower than prior year, which included provisions
for additional asset protection costs.
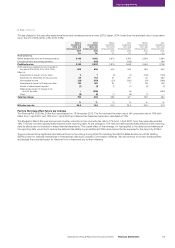
US Regulated
Revenue in our US Regulated businesses was £493m lower
at£7,493m, while adjusted operating profit increased by £21m
to£1,185m.
The stronger US dollar increased operating profit in the year by
£81m. Excluding the impact of foreign exchange rate movements,
revenue decreased by £1,051m, principally as a result of lower
commodity costs passed on to customers and unfavourable
timingof recoveries year over year, partly offset by higher revenue
allowances under the Niagara Mohawk three year rate plan and
thebenefit of capex trackers. The reduction in revenue was mostly
offset by a £1,027m reduction in pass-through costs incurred
(excluding the impact of foreign exchange). Regulated controllable
costs reduced by £71m at constant currency, partly as a result of
lower gas leak and compliance work this year and additional costs
incurred last year to improve data quality and bring regulatory filings
up to date. Depreciation and amortisation costs were £51m higher
this year at constant currency as a result of ongoing investment in
our networks. Pension costs were £15m higher at constant currency
due to changes in actuarial discount rates, while other operating
costs were £41m higher at constant currency including higher asset
removal costs.
Our capital investment programme continues in the US, with a
further £1,856m invested in 2015/16, including spend on gas mains
replacement, gas customer growth and electric system reinforcement.
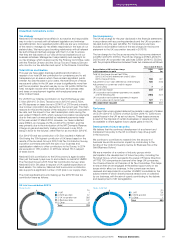
Other activities
Revenue in Other activities increased by £114m to £876m in the year
ended 31 March 2016. Adjusted operating profit was £175m higher
at £374m.
In the US, adjusted operating profit was £143m higher, reflecting
lower spend on upgrades to our finance systems which completed
last year. In addition, we benefited from a £49m gain on disposal of
our investment in the Iroquois pipeline, andthe deconsolidation of
our investment in Clean Line. In the UK, adjusted operating profit
was£32m higher as a result of strong auction revenues at the French
interconnector and higher property sales. Capital investment in our
Other activities was at a similar levelto last year at £218m.
Financial Statements
107National Grid Annual Report and Accounts 2015/16 Financial Statements