National Grid 2016 Annual Report Download - page 154
Download and view the complete annual report
Please find page 154 of the 2016 National Grid annual report below. You can navigate through the pages in the report by either clicking on the pages listed below, or by using the keyword search tool below to find specific information within the annual report.-
 1
1 -
2
-
3
-
4
-
5
-
6
-
7
-
8
-
9
-
10
-
11
-
12
-
13
-
14
-
15
-
16
-
17
-
18
-
19
-
20
-
21
-
22
-
23
-
24
-
25
-
26
-
27
-
28
-
29
-
30
-
31
-
32
-
33
-
34
-
35
-
36
-
37
-
38
-
39
-
40
-
41
-
42
-
43
-
44
-
45
-
46
-
47
-
48
-
49
-
50
-
51
-
52
-
53
-
54
-
55
-
56
-
57
-
58
-
59
-
60
-
61
-
62
-
63
-
64
-
65
-
66
-
67
-
68
-
69
-
70
-
71
-
72
-
73
-
74
-
75
-
76
-
77
-
78
-
79
-
80
-
81
-
82
-
83
-
84
-
85
-
86
-
87
-
88
-
89
-
90
-
91
-
92
-
93
-
94
-
95
-
96
-
97
-
98
-
99
-
100
-
101
-
102
-
103
-
104
-
105
-
106
-
107
-
108
-
109
-
110
-
111
-
112
-
113
-
114
-
115
-
116
-
117
-
118
-
119
-
120
-
121
-
122
-
123
-
124
-
125
-
126
-
127
-
128
-
129
-
130
-
131
-
132
-
133
-
134
-
135
-
136
-
137
-
138
-
139
-
140
-
141
-
142
-
143
-
 144
144 -
 145
145 -
 146
146 -
 147
147 -
 148
148 -
 149
149 -
 150
150 -
 151
151 -
 152
152 -
 153
153 -
 154
154 -
 155
155 -
 156
156 -
 157
157 -
 158
158 -
 159
159 -
 160
160 -
 161
161 -
 162
162 -
 163
163 -
 164
164 -
165
-
166
-
167
-
168
-
169
-
170
-
171
-
172
-
173
-
174
-
175
-
176
-
177
-
178
-
179
-
180
-
181
-
182
-
183
-
184
-
185
-
186
-
187
-
188
-
189
-
190
-
191
-
192
-
193
-
194
-
195
-
196
-
197
-
198
-
199
-
200
-
201
-
202
-
203
-
204
-
205
-
206
-
207
-
208
-
209
-
210
-
211
-
212
 |
 |

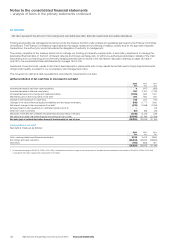
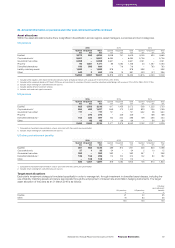
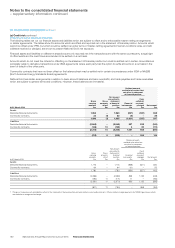
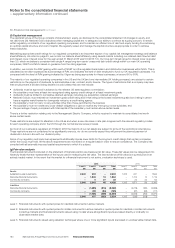
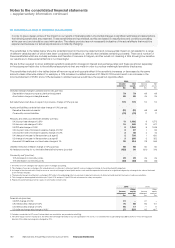
30. Financial risk management continued
(c) Interest rate risk continued
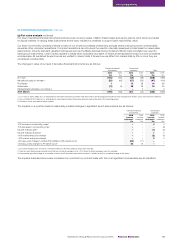
During 2016 and 2015, net debt was managed using derivative instruments to hedge interest rate risk as follows:
2016 2015
Fixed rate
£m
Floating
rate
£m
Inflation
linked
£m
Other1
£m
Total
£m
Fixed rate
£m
Floating
rate
£m
Inflation
linked
£m
Other1
£m
Total
£m
Cash and cash equivalents 1126 – – 127 1118 – – 119
Financial investments 54 2,939 – 5 2,998 281 2,273 – 5 2,559
Borrowings2(17,706) (3,008) (7,62 9) (1) (28,344) (16,229) (2,746) (6,933) (2) (25,910)
Pre-derivative position (17,651) 57 (7,629) 4(25,219) (15,947) (355) (6,933) 3(23,232)
Derivative effect31,788 (2,481) 587 –(106) 1,593 (2,294) 18 –(683)
Net debt position (15,863) (2,424) (7,042) 4(25,325) (14,354) (2,649) (6,915) 3(23,915)
1. Represents financial instruments which are not directly affected by interest rate risk, such as investments in equity or other similar financial instruments.
2. Includes bank overdrafts.
3. The impact of 2016/17 (2015: 2015/16) maturing short-dated interest rate derivatives is included.
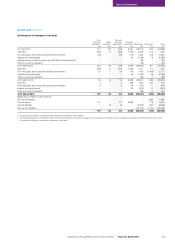
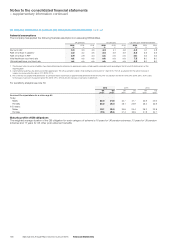
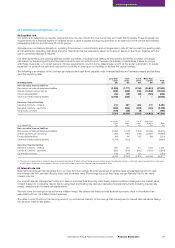
(d) Currency risk
National Grid operates internationally and is exposed to foreign exchange risk arising from various currency exposures, primarily with
respecttothe dollar. Foreign exchange risk arises from future commercial transactions, recognised assets and liabilities, and investments
inforeignoperations.
Our policy for managing foreign exchange transaction risk is to hedge contractually committed foreign currency cash flows over a prescribed
minimum size. Where foreign currency cash flow forecasts are less certain, our policy is to hedge a proportion of such cash flows based on
theprobability of those cash flows occurring. Instruments used to manage foreign exchange transaction risk include foreign exchange forward
contracts and foreign exchange swaps.
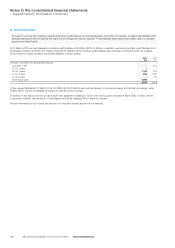
Our policy for managing foreign exchange translation risk relating to our net investment in foreign operations is to maintain a percentage of
netdebt and foreign exchange forwards so as to provide an economic offset. The primary managed foreign exchange exposure arises from the
dollar denominated assets and liabilities held by our US operations, with a further small euro exposure in respect of a joint venture investment.
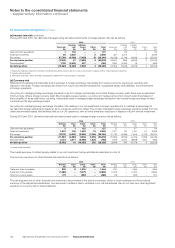
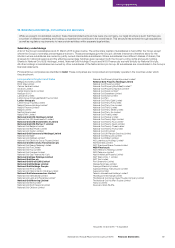
During 2016 and 2015, derivative financial instruments were used to manage foreign currency risk as follows:
2016 2015
Sterling
£m
Euro
£m
Dollar
£m
Other
£m
Total
£m
Sterling
£m
Euro
£m
Dollar
£m
Other
£m
Total
£m
Cash and cash equivalents 3 1 123 –127 12 –107 –119
Financial investments 1,201 105 1,622 70 2,998 1,227 90 1,181 61 2,559
Borrowings1(13,131) (5,061) (8,806) (1,346) (28,344) (11,791) (5,099) ( 7, 6 0 4 ) (1,416) (25,910)
Pre-derivative position (11,927) (4,955) (7,0 61) (1,276) (25,219) (10,552) (5,009) (6,316) (1,355) (23,232)
Derivative effect 2,374 4,971 (8,989) 1,538 (106) 1,608 5,203 (8,858) 1,364 (683)
Net debt position (9,553) 16 (16,050) 262 (25,325) (8,944) 194 (15,174) 9(23,915)
1. Includes bank overdrafts.
The overall exposure to dollars largely relates to our net investment hedge activities as described in note 15.
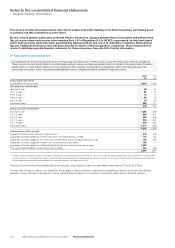
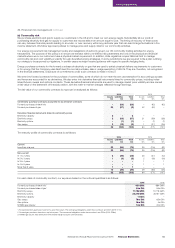
The currency exposure on other financial instruments is as follows:
2016 2015
Sterling
£m
Euro
£m
Dollar
£m
Other
£m
Total
£m
Sterling
£m
Euro
£m
Dollar
£m
Other
£m
Total
£m
Trade and other receivables 220 81,236 –1,464 200 –1,495 –1,695
Trade and other payables (1,380) –(1,471) –(2,851) (1,403) –(1,457) –(2,860)
Other non-current assets (17) –(252) –(269) (19) –(252) –(271)
The carrying amounts of other financial instruments are denominated in the above currencies, which in most instances are the functional
currency of the respective subsidiaries. Our exposure to dollars is due to activities in our US subsidiaries. We do not have any other significant
exposure to currency risk on these balances.
152 National Grid Annual Report and Accounts 2015/16 Financial Statements
Notes to the consolidated financial statements
– supplementary information continued