National Grid 2016 Annual Report Download - page 111
Download and view the complete annual report
Please find page 111 of the 2016 National Grid annual report below. You can navigate through the pages in the report by either clicking on the pages listed below, or by using the keyword search tool below to find specific information within the annual report.-
 1
1 -
2
-
3
-
4
-
5
-
6
-
7
-
8
-
9
-
10
-
11
-
12
-
13
-
14
-
15
-
16
-
17
-
18
-
19
-
20
-
21
-
22
-
23
-
24
-
25
-
26
-
27
-
28
-
29
-
30
-
31
-
32
-
33
-
34
-
35
-
36
-
37
-
38
-
39
-
40
-
41
-
42
-
43
-
44
-
45
-
46
-
47
-
48
-
49
-
50
-
51
-
52
-
53
-
54
-
55
-
56
-
57
-
58
-
59
-
60
-
61
-
62
-
63
-
64
-
65
-
66
-
67
-
68
-
69
-
70
-
71
-
72
-
73
-
74
-
75
-
76
-
77
-
78
-
79
-
80
-
81
-
82
-
83
-
84
-
85
-
86
-
87
-
88
-
89
-
90
-
91
-
92
-
93
-
94
-
95
-
96
-
97
-
98
-
99
-
100
-
 101
101 -
 102
102 -
 103
103 -
 104
104 -
 105
105 -
 106
106 -
 107
107 -
 108
108 -
 109
109 -
 110
110 -
 111
111 -
 112
112 -
 113
113 -
 114
114 -
 115
115 -
 116
116 -
 117
117 -
 118
118 -
 119
119 -
 120
120 -
 121
121 -
122
-
123
-
124
-
125
-
126
-
127
-
128
-
129
-
130
-
131
-
132
-
133
-
134
-
135
-
136
-
137
-
138
-
139
-
140
-
141
-
142
-
143
-
144
-
145
-
146
-
147
-
148
-
149
-
150
-
151
-
152
-
153
-
154
-
155
-
156
-
157
-
158
-
159
-
160
-
161
-
162
-
163
-
164
-
165
-
166
-
167
-
168
-
169
-
170
-
171
-
172
-
173
-
174
-
175
-
176
-
177
-
178
-
179
-
180
-
181
-
182
-
183
-
184
-
185
-
186
-
187
-
188
-
189
-
190
-
191
-
192
-
193
-
194
-
195
-
196
-
197
-
198
-
199
-
200
-
201
-
202
-
203
-
204
-
205
-
206
-
207
-
208
-
209
-
210
-
211
-
212
 |
 |
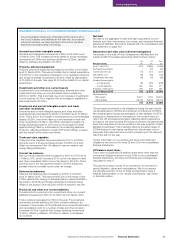
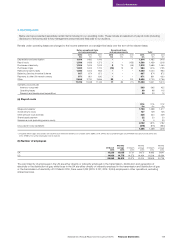
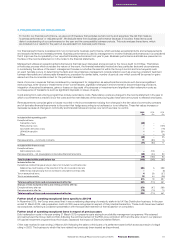
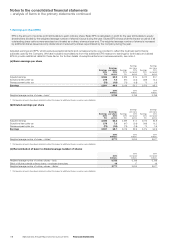
3. Operating costs
Below we have presented separately certain items included in our operating costs. These include a breakdown of payroll costs (including
disclosure of amounts paid to key management personnel) and fees paid to our auditors.
Rentals under operating leases are charged to the income statement on a straight-line basis over the term of the relevant lease.
Before exceptional items
andremeasurements
Exceptional items
andremeasurements Total
2016
£m
2015
£m
2014
£m
2016
£m
2015
£m
2014
£m
2016
£m
2015
£m
2014
£m
Depreciation and amortisation 1,614 1,482 1,416 –– – 1,614 1,482 1,416
Payroll costs 1,506 1,459 1,373 ––(155) 1,506 1,459 1,218
Purchases of electricity 1,304 1,615 1,513 870 (49) 1,312 1,685 1,464
Purchases of gas 1,003 1,403 1,722 (19) 13 33 984 1,416 1,755
Rates and property taxes 1,050 1,004 963 –– – 1,050 1,004 963
Balancing Services Incentive Scheme 907 874 872 –– – 907 874 872
Payments to other UK network owners 971 801 630 –– – 971 801 630
Other 2,664 2,700 2,656 22 –100 2,686 2,700 2,756
11,019 11,33 8 11,145 11 83 (71) 11,030 11,421 11,074
Operating costs include:
Inventory consumed 303 365 422
Operating leases 99 98 115
Research and development expenditure 29 23 12
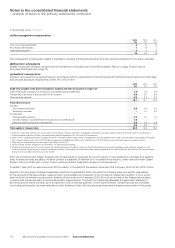
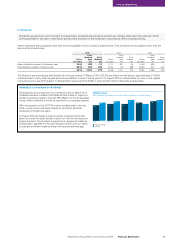
(a) Payroll costs
2016
£m
2015
£m
20141
£m
Wages and salaries11,720 1,598 1,377
Social security costs 137 129 126
Other pension costs (note 22) 238 224 229
Share-based payment 22 20 20
Severance costs (excluding pension costs) 5430
2,122 1,975 1,782
Less: payroll costs capitalised (616) (516) (564)
1,506 1,459 1,218
1. Included within wages and salaries are US other post-retirement benefit costs of £52m (2015: £39m; 2014: £44m) and a curtailment gain on LIPA MSA transaction of £nil (2015: £nil;
2014:£198m). For further information refer to note 22.
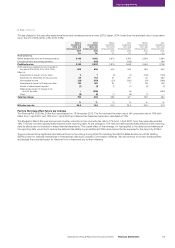
(b) Number of employees
31 March
2016
Monthly
average
2016
31 March
2015
Monthly
average
2015
31 March
2014
Monthly
average
2014
UK 10,238 10,035 9,701 9,670 9,693 9,641
US 14,830 14,775 14,573 14,434 14,216 15,094
25,068 24,810 24,274 24,104 23,909 24,735
The vast majority of employees in the US are either directly or indirectly employed in the transmission, distribution and generation of
electricityor the distribution of gas, while those in the UK are either directly or indirectly employed in the transmission and distribution of gas
orthe transmission of electricity. At 31 March 2016, there were 2,232 (2015: 2,131; 2014: 2,044) employees in other operations, excluding
shared services.
Financial Statements
109National Grid Annual Report and Accounts 2015/16 Financial Statements