National Grid 2016 Annual Report Download - page 200
Download and view the complete annual report
Please find page 200 of the 2016 National Grid annual report below. You can navigate through the pages in the report by either clicking on the pages listed below, or by using the keyword search tool below to find specific information within the annual report.-
 1
1 -
2
-
3
-
4
-
5
-
6
-
7
-
8
-
9
-
10
-
11
-
12
-
13
-
14
-
15
-
16
-
17
-
18
-
19
-
20
-
21
-
22
-
23
-
24
-
25
-
26
-
27
-
28
-
29
-
30
-
31
-
32
-
33
-
34
-
35
-
36
-
37
-
38
-
39
-
40
-
41
-
42
-
43
-
44
-
45
-
46
-
47
-
48
-
49
-
50
-
51
-
52
-
53
-
54
-
55
-
56
-
57
-
58
-
59
-
60
-
61
-
62
-
63
-
64
-
65
-
66
-
67
-
68
-
69
-
70
-
71
-
72
-
73
-
74
-
75
-
76
-
77
-
78
-
79
-
80
-
81
-
82
-
83
-
84
-
85
-
86
-
87
-
88
-
89
-
90
-
91
-
92
-
93
-
94
-
95
-
96
-
97
-
98
-
99
-
100
-
101
-
102
-
103
-
104
-
105
-
106
-
107
-
108
-
109
-
110
-
111
-
112
-
113
-
114
-
115
-
116
-
117
-
118
-
119
-
120
-
121
-
122
-
123
-
124
-
125
-
126
-
127
-
128
-
129
-
130
-
131
-
132
-
133
-
134
-
135
-
136
-
137
-
138
-
139
-
140
-
141
-
142
-
143
-
144
-
145
-
146
-
147
-
148
-
149
-
150
-
151
-
152
-
153
-
154
-
155
-
156
-
157
-
158
-
159
-
160
-
161
-
162
-
163
-
164
-
165
-
166
-
167
-
168
-
169
-
170
-
171
-
172
-
173
-
174
-
175
-
176
-
177
-
178
-
179
-
180
-
181
-
182
-
183
-
184
-
185
-
186
-
187
-
188
-
189
-
 190
190 -
 191
191 -
 192
192 -
 193
193 -
 194
194 -
 195
195 -
 196
196 -
 197
197 -
 198
198 -
 199
199 -
 200
200 -
 201
201 -
 202
202 -
 203
203 -
 204
204 -
 205
205 -
 206
206 -
 207
207 -
 208
208 -
 209
209 -
 210
210 -
211
-
212
 |
 |
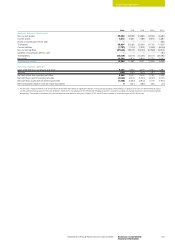
Analysis of the adjusted operating profit by segment for
the year ended 31 March 2015
UK Electricity Transmission
For the year ended 31 March 2015, revenue in the UK ET segment
was £367 million higher at £3,754 million, and adjusted operating
profit increased by £150 million to £1,237 million.
Net regulated income after pass-through costs was £230 million higher,
principally reflecting increases in allowed Transmission Owner revenues
this year and a £43 million benefit relating to legal settlements. This
was partially offset by under-recoveries of allowed revenue in the year
of £89 million compared with under-recoveries of £60 million in the
prior year. Regulated controllable costs were £14 million higher due to
inflation, organisational change costs and additional tower maintenance
costs. Depreciation and amortisation was £33 million higher reflecting
the continued capital investment programme (investment in the year
was £1,074 million). Other costs were £4 million higher than prior year.
UK Gas Transmission
Revenue in the UK GT segment increased by £81 million in 2014/15 to
£1,022 million and adjusted operating profit increased by £20 million
to £437 million.
Net regulated income after pass-through costs was £42 million higher
due to earned gas permit and constraints management incentives. In
addition, under-recoveries of allowed revenue in the year of £18 million
were £3 million favourable to last year’s under-recoveries of £21 million.
Partially offsetting the revenue gains, regulated controllable costs
were £8 million higher, mainly as a result of additional system operator
costs relating to EU work and some organisation change costs. Other
operating costs were also £17 million higher, including a £13 million
provision for decommissioning the Avonmouth LNG plant. Capital
investment remained around the same level as last year at £184 million.
UK Gas Distribution
UK GD revenue decreased by £31 million in 2014/15 to £1,867million,
and adjusted operating profit decreased by £78 million to £826million.
Net regulated income after pass-through costs was £11 million
lower, reflecting changes in allowed revenues for replacement
expenditure (repex). Timing differences reduced net revenues by
a further £16 million, with £13 million over-recoveries in 2014/15,
compared with a £29 million over-recovery in the prior year. Regulated
controllable costs were £22 million higher primarily due to inflation
and some organisation change costs. Depreciation and amortisation
was £15 million higher reflecting the continued capital investment
programme (investment in the year was £498 million). Other costs
were £14 million higher, reflecting a provision for additional asset
protection costs.
US Regulated
Revenue in our US Regulated business was £54 million lower in
2014/15 at £7,986 million, while adjusted operating profit increased
by £39 million to £1,164 million.
The stronger dollar increased operating profit in the year by
£30 million. Excluding the impact of foreign exchange, net regulated
income increased by £81 million, reflecting increased revenue from
existing rate plans, including capex trackers, together with additional
income from gas customer growth, partially offset by the impact of
the end of LIPA management services activities (MSA) in December
2013. In addition, over-recoveries of allowed revenues in the year of
£30 million were £20 million favourable to last year’s over-recoveries
of £10 million. Regulated controllable costs increased by £17 million
excluding the impact of foreign exchange, as a result of increased gas
leak and compliance work and additional costs incurred to improve
data quality and bring regulatory filings up to date, partly offset
by the cessation of costs associated with the LIPA MSA activities.
Bad debt costs were £62 million higher excluding the impact of
foreign exchange, following last year’s exceptionally cold winter.
There were no major storms affecting our operations in the years
ended 31 March 2014 and 2015.
Our capital investment programme continued in the US, with a further
£1,501 million invested in 2014/15, including gas leak reduction
programmes and electricity capacity and reinforcement work.
Other activities
Revenue in Other activities increased by £26 million to £762 million
in the year ended 31 March 2015. Adjusted operating profit was
£68 million higher at £199 million.
Operating profit in the French interconnector was £18 million higher as
a result of strong auction revenues this year. In the US, corporate and
other activities losses were £63 million lower, mainly as a result of our
finance system upgrade completing in the first half of this year. Capital
investment in our Other activities was £33 million higher at £213 million.
198 National Grid Annual Report and Accounts 2015/16 Additional Information
Other unaudited financial information continued