National Grid 2016 Annual Report Download - page 175
Download and view the complete annual report
Please find page 175 of the 2016 National Grid annual report below. You can navigate through the pages in the report by either clicking on the pages listed below, or by using the keyword search tool below to find specific information within the annual report.-
 1
1 -
2
-
3
-
4
-
5
-
6
-
7
-
8
-
9
-
10
-
11
-
12
-
13
-
14
-
15
-
16
-
17
-
18
-
19
-
20
-
21
-
22
-
23
-
24
-
25
-
26
-
27
-
28
-
29
-
30
-
31
-
32
-
33
-
34
-
35
-
36
-
37
-
38
-
39
-
40
-
41
-
42
-
43
-
44
-
45
-
46
-
47
-
48
-
49
-
50
-
51
-
52
-
53
-
54
-
55
-
56
-
57
-
58
-
59
-
60
-
61
-
62
-
63
-
64
-
65
-
66
-
67
-
68
-
69
-
70
-
71
-
72
-
73
-
74
-
75
-
76
-
77
-
78
-
79
-
80
-
81
-
82
-
83
-
84
-
85
-
86
-
87
-
88
-
89
-
90
-
91
-
92
-
93
-
94
-
95
-
96
-
97
-
98
-
99
-
100
-
101
-
102
-
103
-
104
-
105
-
106
-
107
-
108
-
109
-
110
-
111
-
112
-
113
-
114
-
115
-
116
-
117
-
118
-
119
-
120
-
121
-
122
-
123
-
124
-
125
-
126
-
127
-
128
-
129
-
130
-
131
-
132
-
133
-
134
-
135
-
136
-
137
-
138
-
139
-
140
-
141
-
142
-
143
-
144
-
145
-
146
-
147
-
148
-
149
-
150
-
151
-
152
-
153
-
154
-
155
-
156
-
157
-
158
-
159
-
160
-
161
-
162
-
163
-
164
-
 165
165 -
 166
166 -
 167
167 -
 168
168 -
 169
169 -
 170
170 -
 171
171 -
 172
172 -
 173
173 -
 174
174 -
 175
175 -
 176
176 -
 177
177 -
 178
178 -
 179
179 -
 180
180 -
 181
181 -
 182
182 -
 183
183 -
 184
184 -
 185
185 -
186
-
187
-
188
-
189
-
190
-
191
-
192
-
193
-
194
-
195
-
196
-
197
-
198
-
199
-
200
-
201
-
202
-
203
-
204
-
205
-
206
-
207
-
208
-
209
-
210
-
211
-
212
 |
 |
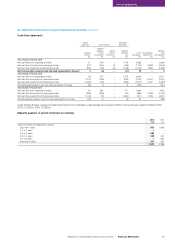
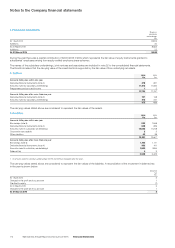
4. Derivative financial instruments
The fair values of derivative financial instruments are:
2016 2015
Assets
£m
Liabilities
£m
Total
£m
Assets
£m
Liabilities
£m
Total
£m
Amounts falling due within one year 279 (239) 40 281 (289) (8)
Amounts falling due after more than one year 157 (358) (201) 148 (411) (263)
436 (597) (161) 429 (700) (271)
For each class of derivative the notional contract1 amounts are as follows:
2016
£m
2015
£m
Interest rate swaps (2,442) (2,499)
Cross-currency interest rate swaps (3,537) (3,529)
Foreign exchange forward contracts (14,361) (13,708)
(20,340) (19,736)
1. The notional contract amounts of derivatives indicate the gross nominal value of transactions outstanding at the balance sheet date.
5. Investments
The following table sets out the Company’s current asset investments:
2016
£m
2015
£m
Investments in short-term money funds 1,007 217
Short-term deposits –252
Restricted balances – collateral 237 281
1,244 750
6. Borrowings
The following table analyses the Company’s total borrowings:
2016
£m
2015
£m
Amounts falling due within one year
Bank overdrafts –13
Bank loans 28 28
Bonds 21 70
Commercial paper 884 957
933 1,068
Amounts falling due after more than one year
Bonds 1,194 1,117
2,127 2,185
The maturity of total borrowings is disclosed in note 34 to the consolidated financial statements. There are no differences in the maturities
ascalculated under IFRS or FRS 101 ‘Reduced Disclosure Framework’.
The notional amount of borrowings outstanding as at 31 March 2016 was £2,101m (2015: £2,157m). Further information on significant
borrowings can be found on the debt investors section of our website.
7. Share capital
The share capital amounting to £447m (2015: £443m) consists of 3,924,038,086 (2015: 3,891,691,900) ordinary shares. For further information
on share capital, refer to note 24 to the consolidated financial statements.
8. Shareholders’ equity and reserves
At 31 March 2016 the profit and loss account reserve stood at £2,880m (2015: £3,726m) of which £86m (2015: £86m) related to gains
onintra-group transactions which was not distributable to shareholders.
For further details of dividends paid and payable to shareholders, refer to note 8 to the consolidated financial statements.
9. Parent Company guarantees
The Company has guaranteed the repayment of the principal sum, any associated premium and interest on specific loans due by certain
subsidiary undertakings primarily to third parties. At 31 March 2016, the sterling equivalent amounted to £2,674m (2015: £2,593m). The
guarantees are for varying terms from less than one year to open-ended.
10. Audit fees
The audit fee in respect of the parent Company was £28,380 (2015: £27,553). Fees payable to PricewaterhouseCoopers LLP for non-audit
services to the Company are not required to be disclosed as they are included within note 3 to the consolidated financial statements.
Financial Statements
173National Grid Annual Report and Accounts 2015/16 Financial Statements